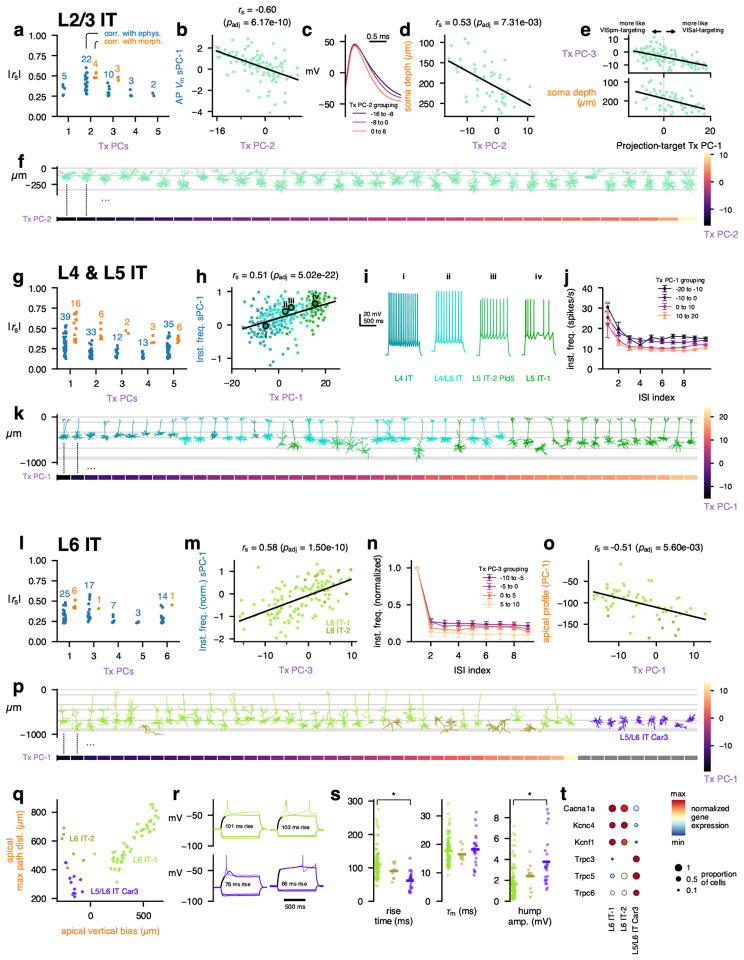
Figure 2: MET characterization of IT subclasses.
a, Spearman correlations between transcriptomic principal components (Tx PCs) and electrophysiology/morphology features for the L2/3 IT subclass. Only statistically significant correlations are shown (B-H adjusted p-values < 0.05); the number of significant correlations per PC and modality are shown above the points. b, Relationship between L2/3 IT Tx PC-2 and the first sparse principal component (sPC-1) of the action potential (AP) waveform. c, Average AP waveforms for cells grouped by transcriptomic PC-2 values. d, Relationship between L2/3 IT Tx PC-2 and soma depth. e, Relationships between a PC derived from VISpm- vs VISal-targeting differentially expressed genes identified by Kim et al. [42] and L2/3 IT Tx PC-3 (top) and soma depth (bottom). f, Example L2/3 IT morphologies (top) ordered by their Tx PC-2 values (bottom). g, Correlations between L4 & L5 IT (L4 IT, L4/L5 IT, L5 IT-1, and L5 IT-2 Pld5) Tx PCs and electrophysiology/morphology features. h, Relationship between L4 & L5 IT Tx PC-1 and the sPC-1 of instantaneous firing frequency. i, Example responses to depolarizing current steps for cells corresponding to points i to iv in (i). j, Average instantaneous firing frequencies by interspike interval (ISI) index for cells grouped by L4 & L5 IT transcriptomic PC-1. k, Example L4 & L5 IT morphologies (top) ordered by their Tx PC-1 values (bottom). l, Correlations between L6 IT (L6 IT-1 and −2) Tx PCs and electrophysiology/morphology features. Note that L6 IT Tx PC-2 is not shown as it did not exhibit any significant correlations with electrophysiology/morphology features. m, Relationship between L6 IT Tx PC-3 and normalized instantaneous firing frequency sPC-1. n, Average instantaneous firing frequencies, normalized to the first ISI, by ISI index for cells grouped by L6 IT Tx PC-3. o, Relationship between L6 IT Tx PC-1 and the apical depth profile PC-1. p, Example L6 IT morphologies (top) ordered by their Tx PC-1 values (bottom). Example L5/L6 IT Car3 morphologies are also shown for comparison; they were not included in the L6 IT PCA as they exhibit highly distinct transcriptomic profiles and so do not have Tx PC-1 values (gray). q, Relationship between the apical vertical bias and maximum path distance within the apical dendrite. r, Example responses to subthreshold (thick line) and suprathreshold (thin line) depolarizing current steps. The interval in which the voltage rose between 10% and 90% of its steady-state value is indicated (black) and the rise time shown. Colors indicate MET-types as in (q). s, Comparison of rise times (left), membrane time constants (middle), and depolarizing ”hump” amplitudes (right) between L6 IT-1, −2, and L5/L6 IT Car3 cells. t, Differentially expressed ion channels between L6 IT-1 and L5/L6 IT Car3. L6 IT-2 also shown for comparison.

