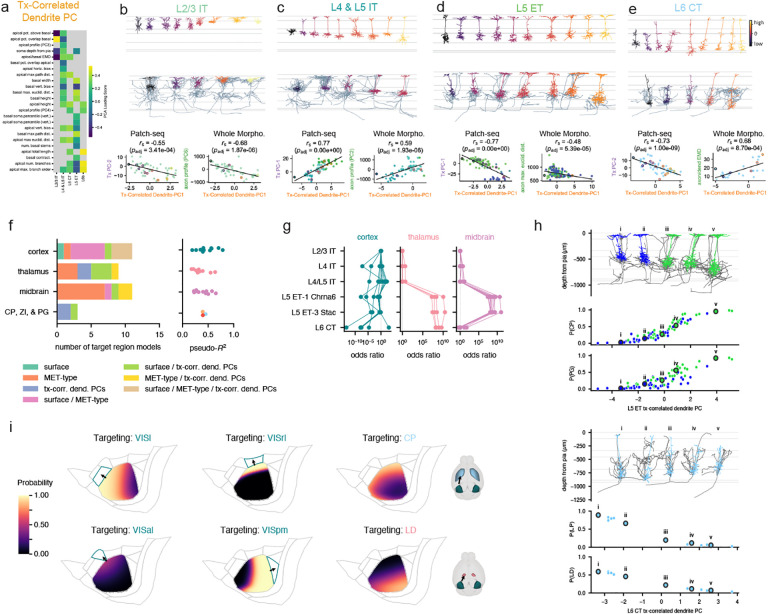
Figure 6: Projection target prediction using multimodal properties.
a, Dendritic features that were highly correlated with the transcriptomic PCs described in Figs. 2 and 3 were used to calculate a dendritic PC for each MET-type. b-e, Morphologies from Patch-seq and WNM ordered and colored by dendritic PC value. Correlations between dendritic PC and transcriptomic PC are shown for Patch-seq neurons. Correlations between dendritic PC and local axon features are shown for WNM neurons. f, Types of logistic regression models used to predict whether WNM neurons project to specific targets (left) and pseudo-R2 values for the selected models (right). Models were selected by Akaike information criterion (Methods). g, MET-type odds ratios for models that used MET-type to predict projection targets. Higher odds ratios represent higher probabilities of projection associated with those MET-types. Odds ratios were defined relative to L2/3 IT (always set to 1). h, Effects of transcriptomic-correlated dendritic PCs on projection probabilities. Higher values of the L5 ET dendritic PC were associated with a higher chance of projecting to CP and PG. Lower values of the L6 CT dendritic PC were associated with a higher chance of projecting to LP and LD thalamus. i, Effects of cortical surface location on projections to different cortical and subcortical targets.

