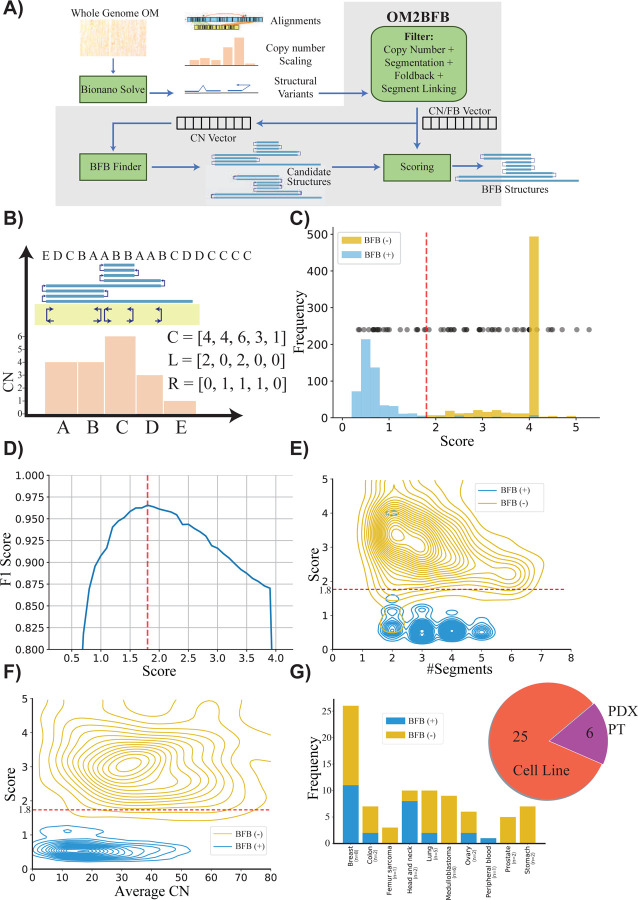
Figure 1: Detecting and reconstructing BFB amplicons using Optical Genome Maps.
A) Workflow of OM2BFB pipeline depicting the sequential steps involved in the analysis (Methods).
B) Schematic representation of OM2BFB output. The axes display genomic coordinates (x-axis) and copy-number (CN) (y-axis), with a separate track showing fold-backs. Orange bars represent segments with their respective copy numbers, navy arrows on the yellow background indicate foldback reads, and the blue rectangle on top represents the BFB structure described by an ordering of segment labels. The proposed BFB structure can be read by marking the segments traversed by the blue line, starting from the centromeric end. The vectors, C, L, and R refer to the copy number, left-, and right-foldback SVs that support the BFB.
C) Distribution of OM2BFB scores for 681 simulated BFB negative (BFB(−)) cases and 595 simulated positive (BFB(+)) cases. Notably, 490 negative cases did not meet the filtering threshold and were reported with a high score (4) by OM2BFB. Black dots (placed at an arbitrary position on the y-axis for ease of visualization) represent the OM2BFB scores of 84 amplicons obtained from 31 cell-lines. The red line at 1.8 marks the threshold from (D) for defining BFB(+) from BFB(−) cases.
D) The F1 scores of OM2BFB, measured for different score cut-offs. The highest F1 score was achieved at a threshold of 1.8, and that score was selected as the threshold for separating BFB (+) from BFB(−) cases.
E) Distribution of OM2BFB scores across the number of segments in the simulated cases. The BFB(+) sample scores are independent of the number of segments, while BFB(−) samples reveal a slight bias of decreasing scores with higher number of segments.
F) Distribution of OM2BFB scores across the average segments’ copy numbers in the simulated cases shows independence between the score and average copy number.
G) (Right) Distribution of OGM data types from 31 samples that include cancer cell lines, PDX models, and primary tumors (PT). (Left) Distribution of BFB(+) and BFB(−) cases across different cancer subtypes.

