Figure 2:
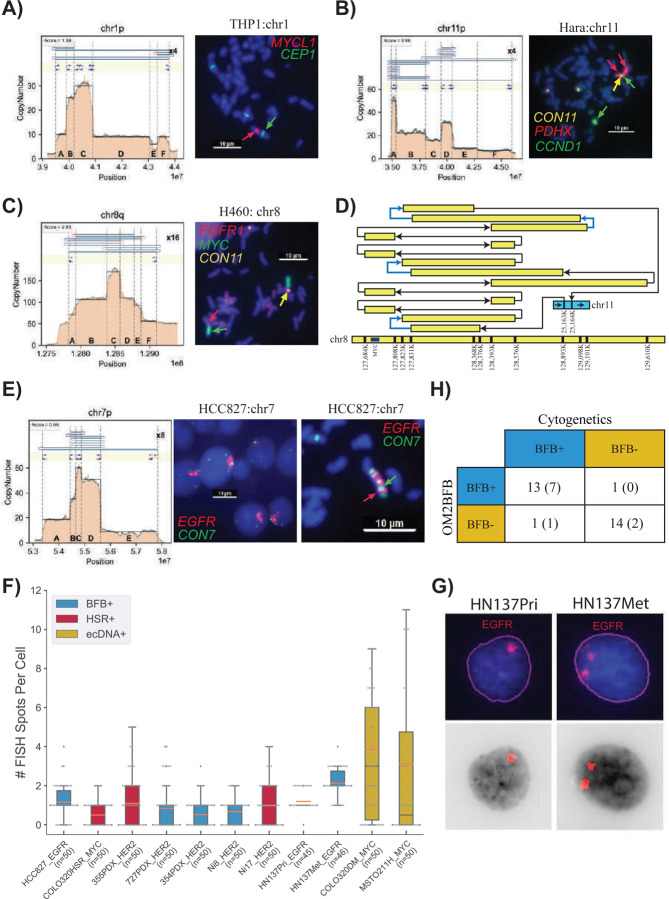
A) Metaphase FISH image for the cancer cell line THP1, showcasing amplification on a native chromosome (chr1) with a score below 1.8. CEN1 is a probe for the centromere on chr1.
B) Metaphase FISH image for the cancer cell line HARA, displaying amplification on a native chromosome arm (chr11p) and also co-occurrence of HARA and CCND1 on the q-arm, suggesting a duplicated translocation of the BFB site from the p arm to the q arm.
C) Metaphase FISH image for the cancer cell line H460, demonstrating amplification on both native (chr 8) and non-native (chr 11) chromosomes with scores exceeding 1.8.
D) Visualization of HSR (homogeneously staining region) amplification on chr 8 (MYC) integrated in chr 11 in the H460 cell line. Blue arrows represent foldback reads within the structure.
E) Metaphase and Interphase FISH images for the cancer cell line HCC827, exhibiting amplification on a native chromosome with a score below 1.8.
F) Distribution of FISH Foci Count among cases with Interphase FISH images, highlighting lower number of foci and also lower variance in the number of foci in BFB and HSR cases compared to ecDNA cases.
G) Visualization of EGFR foci in interphase cells from HN137Pri and HN137Met lines. The top panel shows the original FISH image, while the bottom panel shows the computationally detected foci.
H) Summary of cytogenetic validation of OM2BFB calls. The number in parentheses refers to the number of interphase samples.

