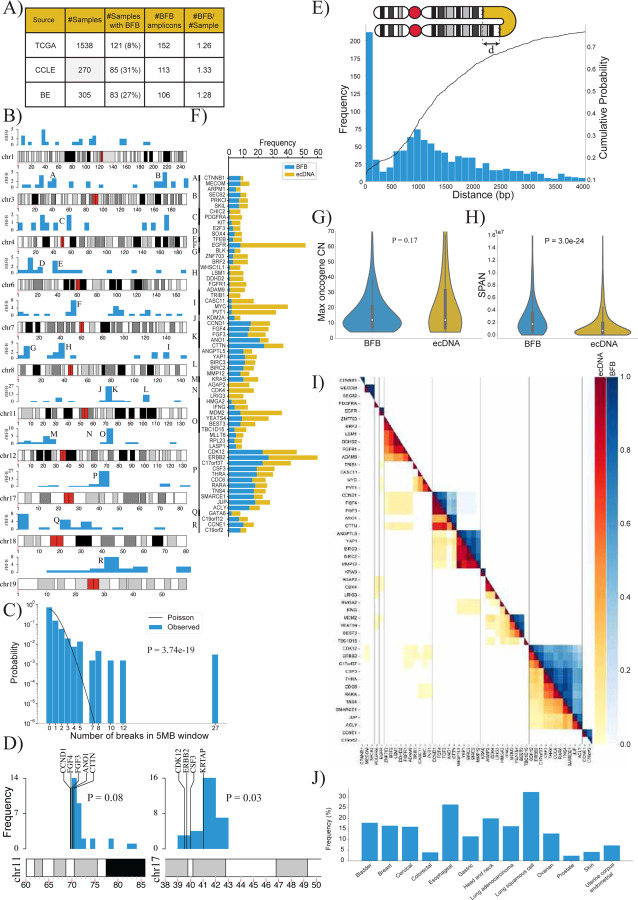
Figure 3:
A) Summary of the number of BFB(+) samples among 2,113 whole genome samples tested for BFB amplification using AmpliconSuite. The data was collected from three data sets: TCGA, BE36 and CCLE37.
B) Locations of the first (most telomeric) break of the 371 BFBs in the human genome (hg38). Chromosomes with fewer than 12 BFBs are not shown.
C) The distribution of BFB occurrences (most telomeric break) in 5 Mbp windows compared against the Poisson distribution to test for randomness (p-value: 3.7e-19, KS test).
D) The randomness of the first break in a 10Mb region, telomeric to an amplified oncogene. Left panel: 29 BFBs on chr11 containing CCND1; Right panel: 30 BFBs on chr17 (ERBB2).
E) Distribution and cumulative distribution of the distance (d) between fold-back reads.
F) Frequencies of the mode of amplification (BFB versus ecDNA) in oncogenes that are amplified at least 8 times in all datasets combined.
G) Violin plot showing the distributions of the maximum oncogene copy number between BFB and ecDNA amplicons (p-value = 0.17 with Ranksum test).
H) Violin plot showing the distributions of amplicon length (SPAN) between BFB and ecDNA amplicons (p-value = 3.0e-24 with Ranksum test).
I) Co-occurrence patterns of amplified oncogenes. Color-coded entry for (i,j) measures the fraction of times genes i and j were both amplified when either gene was amplified. The lower triangle shows ecDNA co-occurrence patterns and the upper triangle shows BFB co-occurrence patterns.
J) Distribution of BFB amplicons over different cancer subtypes. BFB amplicons were not found in brain and CNS related cancers, but were most abundant in lung and head and neck cancers.

