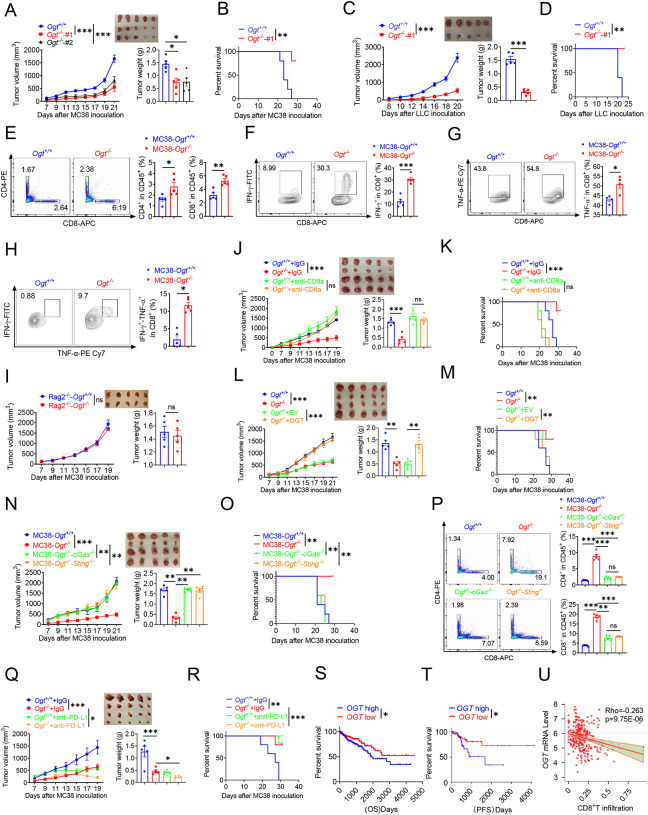
Fig. 6. Ogt deficiency inhibits tumor progression through enhancing infiltration by CD8+ T cells.
A-B) Tumor volume, weight of Ogt+/+ or Ogt−/− MC38 tumors in C57BL/6J mice and mice survival, n=5 respectively. C-D) Tumor volume, weight of Ogt+/+ or Ogt−/− LLC tumors in C57BL/6J mice and mice survival, n=5 respectively. E-H) Flow cytometry analysis of percentage of CD4+ and CD8+ T cells population(E) and IFN-γ+ (F), TNF-α+ (G), IFN-γ+TNF-α+ double positive (H) intratumoral CD8+ T cells population in MC38 tumors, subcutaneous tumor isolated at day 18 post-tumor inoculation, n=5 respectively. I) Tumor volume and weight of Ogt+/+ or Ogt−/− MC38 in Rag2−/− mice, n=5 respectively. J-K) Tumor volume, weight of Ogt+/+ or Ogt−/− MC38 tumors injected with either control IgG or anti-CD8α at day 0, 7 and 14 post tumor inoculation in C57BL/6J mice and mice survival, n=5 respectively. L-M) Tumor volume, weight of Ogt−/− rescued MC38 tumors in C57BL/6J mice, tumor growth volume and weight (L), mice survival (M). N-O) Tumor volume, weight of Ogt−/−cGAS−/− or Ogt−/−Sting−/− double knockout MC38 tumors in C57BL/6J mice, tumor growth volume and weight (N), mice survival (O). P) Flow cytometry analysis showing percentage of CD4+ and CD8+ T cells population (N), CD8+ IFN-γ+ (O), CD8+ TNF-α+ T cell population (P) in Ogt−/−cGAS−/− or Ogt−/−Sting−/− double knockout MC38 tumors in C57BL/6J mice, subcutaneous tumor isolated at day 18 post-tumor inoculation. Q-R) Tumor volume, weight of Ogt+/+ or Ogt−/− MC38 tumors injected with either control IgG or anti-PD-L1 at day 7, 10 and 13 post tumor inoculation in C57BL/6J mice and mice survival, n=5 respectively. S) Kaplan-Meier survival curves for colorectal cancer patients with low (n=207) or high (n=231) OGT transcripts in TCGA dataset. T) Progression-free survival curves for colorectal cancer patients with low (n=58) or high (n=58) OGT transcripts in TCGA dataset. U) Scatterplot presenting the association between the mRNA expression level of OGT and CD8+ T infiltration, Spearman’s r = −0.263, p = 9.75E-6, Spearman’s rank correlation test. Data are representative of two or three independent experiments. Statistical significance was determined by Spearman’s rank correlation test, unpaired Student’s t-test, one-way ANOVA, two-way ANOVA, *p < 0.05, **p < 0.01, ***p < 0.001, ns, no significant difference. Data represent the mean of ± SD.

