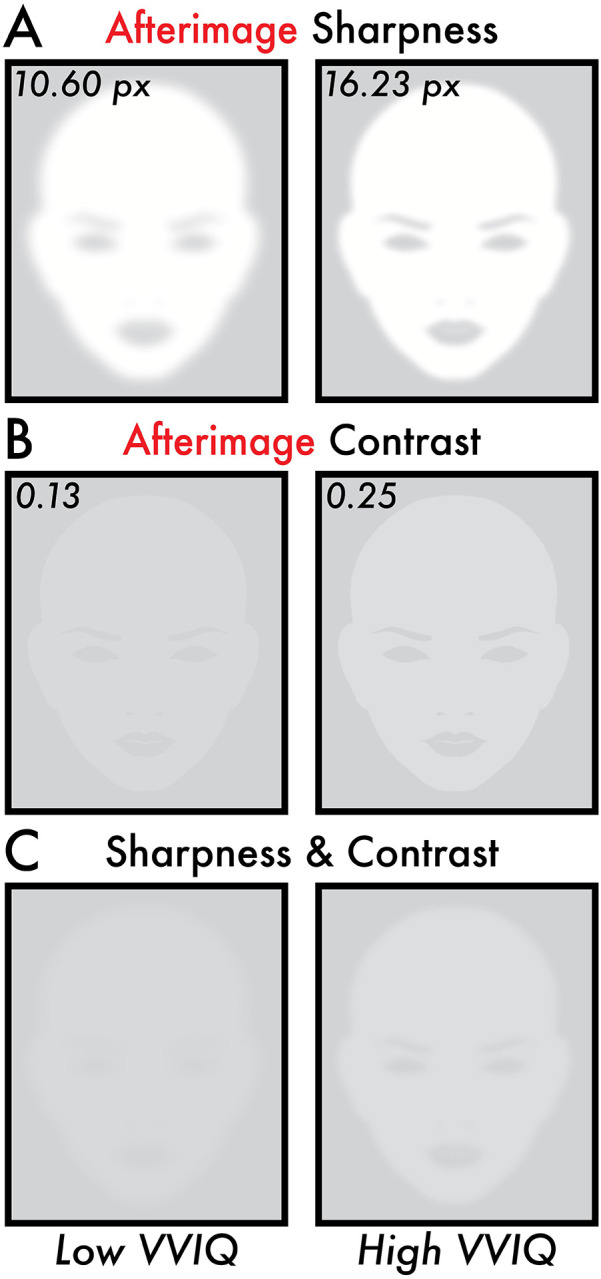
Figure 4. Image reconstruction of the estimated perceived afterimage sharpness and contrast for low and high VVIQ score participants.

All subplots display image reconstructions of the estimated perceived afterimage sharpness and contrast values according to the fitted linear regression trend lines (Figure 3B, D) for low and high Vividness of Visual Imagery Questionnaire (VVIQ) scores. The low and high VVIQ scores are the minimum (24) and maximum (80) VVIQ scores reported among participants (Figure 2B). (A) Image reconstruction of the estimated perceived afterimage sharpness for low (10.60 pixels [px]) and high (16.23 px) VVIQ scores. (B) Image reconstruction of the estimated perceived afterimage contrast for low (0.13) and high (0.25) VVIQ scores. (C) Image reconstruction combining the estimated perceived afterimage sharpness (A) and contrast (B) for low (10.60 px and 0.13) and high (16.23 px and 0.25) VVIQ scores. Image reconstructions show visually apparent differences in the estimated perceived sharpness and contrast of afterimages between low and high VVIQ score participants.
