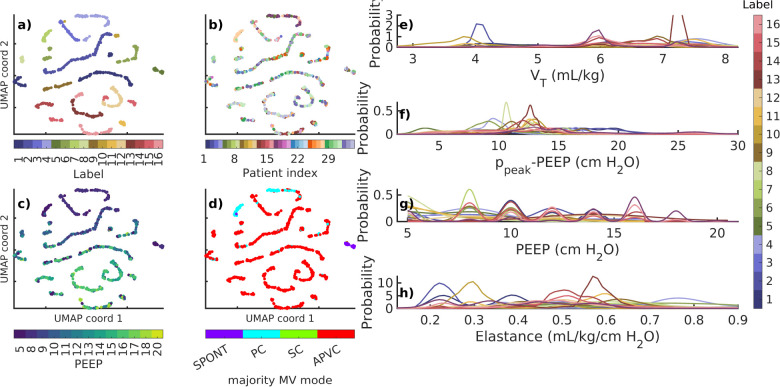
Figure 4:
Membership and data properties associated with 721 phenotypes. Points in panels (a–d) correspond to individual phenotypes in UMAP coordinates. Labels (a) mix patients (b) while defining empirical partitions of other factors of patient data (c–h). Groupings separate PEEP (c,g) and ventilator modes (d), which are arguably among the most important ventilator feature elements. Structured distributional separation occurs for continuous breath variables such as tidal volume (e), driving pressure (f), and elastance . PEEP (c) and ventilator mode (d) of UMAP labels identify the median value of each individual phenotype; probability densities (e–h) are computed from original data and colored according to panel (a). Modes: spontaneous (SPONT), Pressure controlled (PC), Synchronized controlled (SC), and Adaptive Pressure Volume Controlled (APVC)

