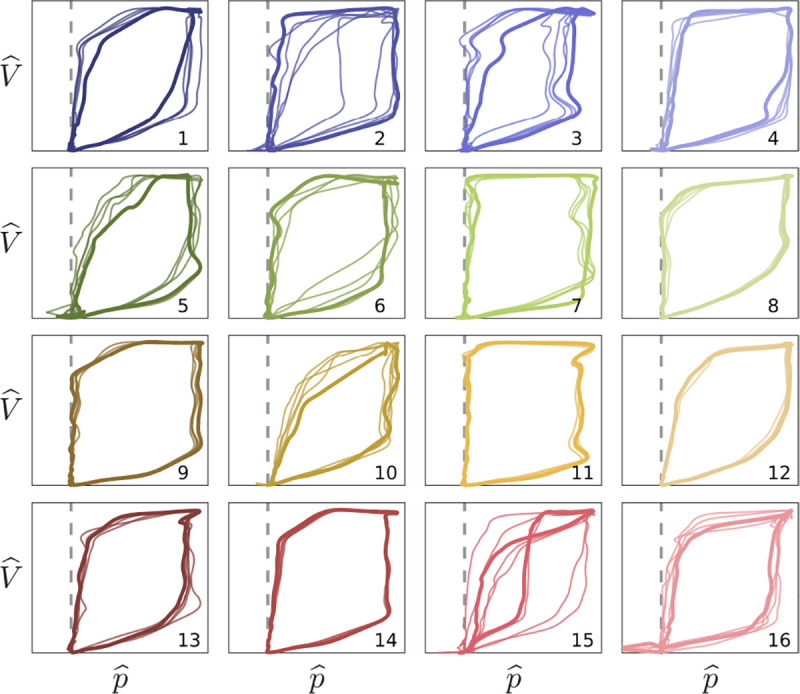
Figure 5:

Non-dimensional waveform shapes. Pressure-volume traces correspond to median (bold) and nearby (thin) window characterizations of each cohort phenotype. Labels and colors correspond to Fig4a. Vertical and horizontal scales axes correspond to and , respectively, respectively, per Fig4e–g The dashed line indicates baseline pressure. Cohort phenotypes differentiate waveform shape characteristics and pressure-volume coordination in conjunction with associated dimensional properties. Intra-group variation is naturally high given the low specificity of each type.
