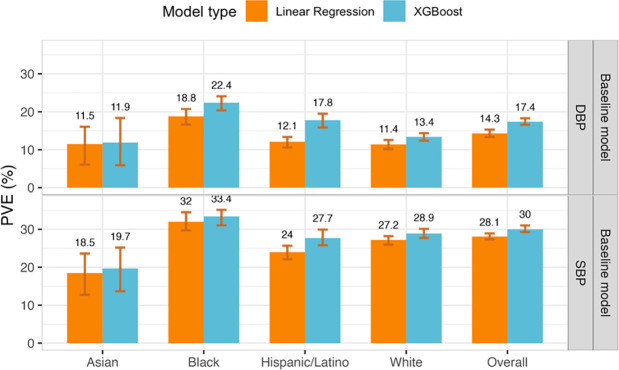
Figure 2: Estimated phenotypic PVE of baseline models fitted using non-linear ML and linear models.
Estimated PVEs in the TOPMed test dataset for baseline model performance for prediction of SBP and DBP in the overall test dataset and stratified by self-reported race/ethnicity (White N = 10,877, Hispanic/Latino N = 3,831, Black N = 3,657, Asian N = 403 for DBP; White N = 10,823, Hispanic/Latino N = 3,877, Black N = 3,674, Asian N = 374 for SBP). The visualized 95% confidence intervals were computed as the 2.5% and 97.5% percentiles of the bootstrap distribution of the PVEs estimated over the test dataset.
PVE: Percent variance explained. TOPMed: Trans-Omics in Precision Medicine project. SBP: systolic blood pressure. DBP: diastolic blood pressure.

