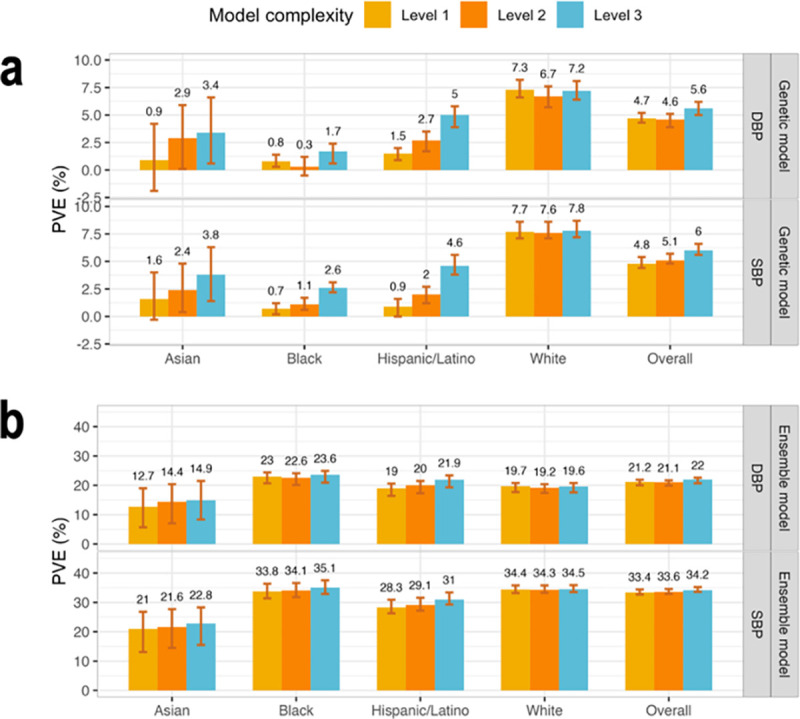
Figure 3: Comparison of genetic and ensemble model performance in TOPMed test dataset.

Panel a: Estimated PVEs in the TOPMed test dataset obtained by genetic models incorporating one or more PRSs according to the three complexity levels. Level 1: a single PRS based on the UKB+ICBP GWAS. Level 2: PRSs based on the UKB+ICBP GWAS based on seven p-value thresholds. Level 3: 21 PRSs, 7 PRSs based on each of the UKB+ICBP, MVP, and BBJ GWAS. PVE is reported for predicting residuals from the baseline model, where the baseline model was a non-linear ML model and only used non-genetic covariates. Panel b: Estimated PVEs in the TOPMed test dataset for ensemble model at the raw phenotypic level. PVEs are reported for models of SBP and DBP, in the overall test dataset and stratified by self-reported race/ethnicity (White N = 10,877, Hispanic/Latino N = 3,831, Black N = 3,657, Asian N = 403 for DBP; White N = 10,823, Hispanic/Latino N = 3,877, Black N = 3,674, Asian N = 374 for SBP). The visualized 95% confidence intervals were computed as the 2.5% and 97.5% percentiles of the bootstrap distribution of the PVEs estimated over the test dataset.
PVE: Percent variance explained. TOPMed: Trans-Omics in Precision Medicine project. SBP: systolic blood pressure. DBP: diastolic blood pressure. PRS: polygenic risk score.
