
Figure 1:
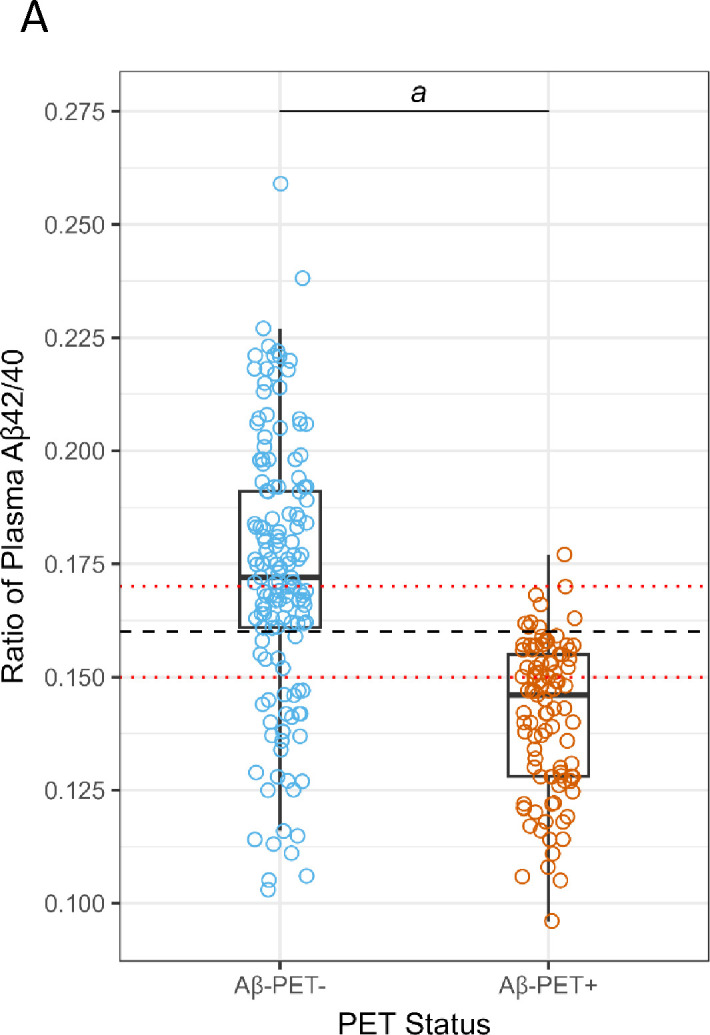

Correlation and diagnostic performance of the Aβ42/40 ratio and amyloid PET imaging. A) Plasma Aβ42/40 ratio compared with amyloid PET status (Aβ-PET− and Aβ-PET+). Black dashed line denotes optimal Aβ42/40 ratio cutoff of 0.160. Red dashed lines denote Aβ42/40 ratio indeterminant risk cutoffs (0.150 and 0.170); a = significant at P < 0.001; B) ROC-AUC of the plasma Aβ42/40 ratio for prediction of amyloid PET positivity. AUC, area under the curve; ROC, receiver operating characteristic.