
Figure 4:
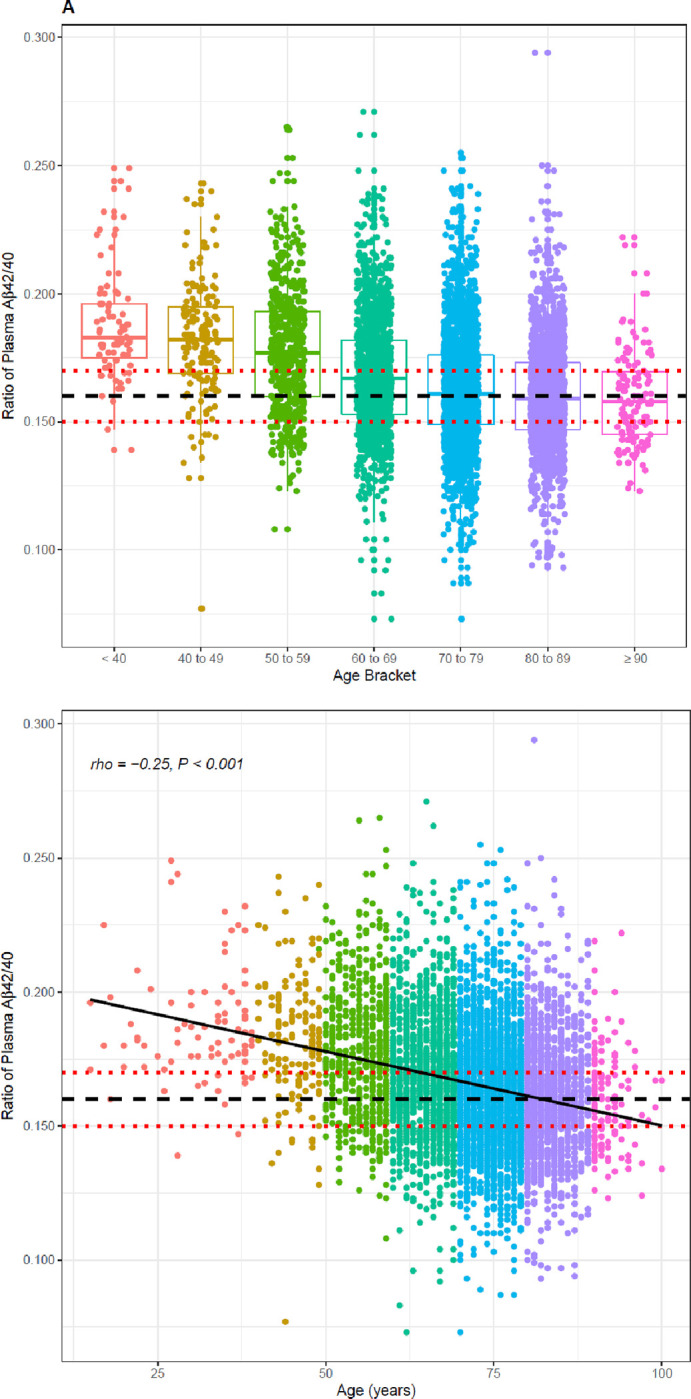
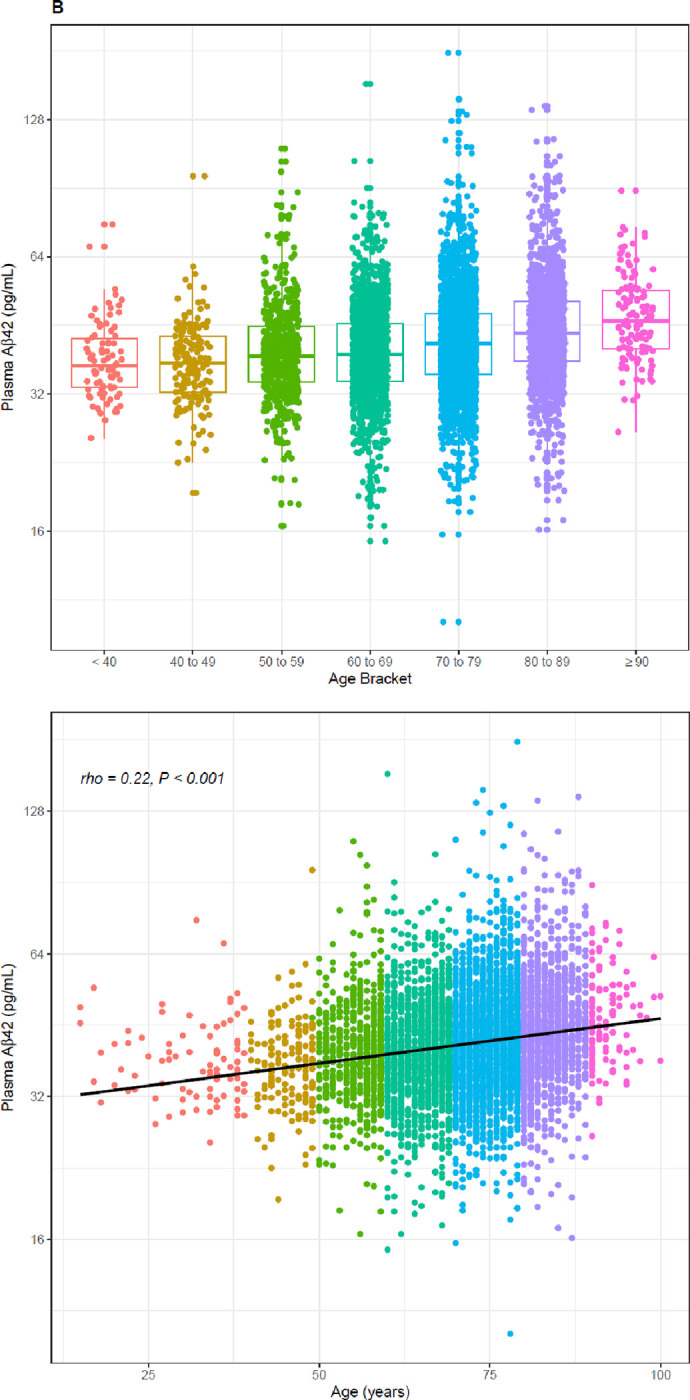
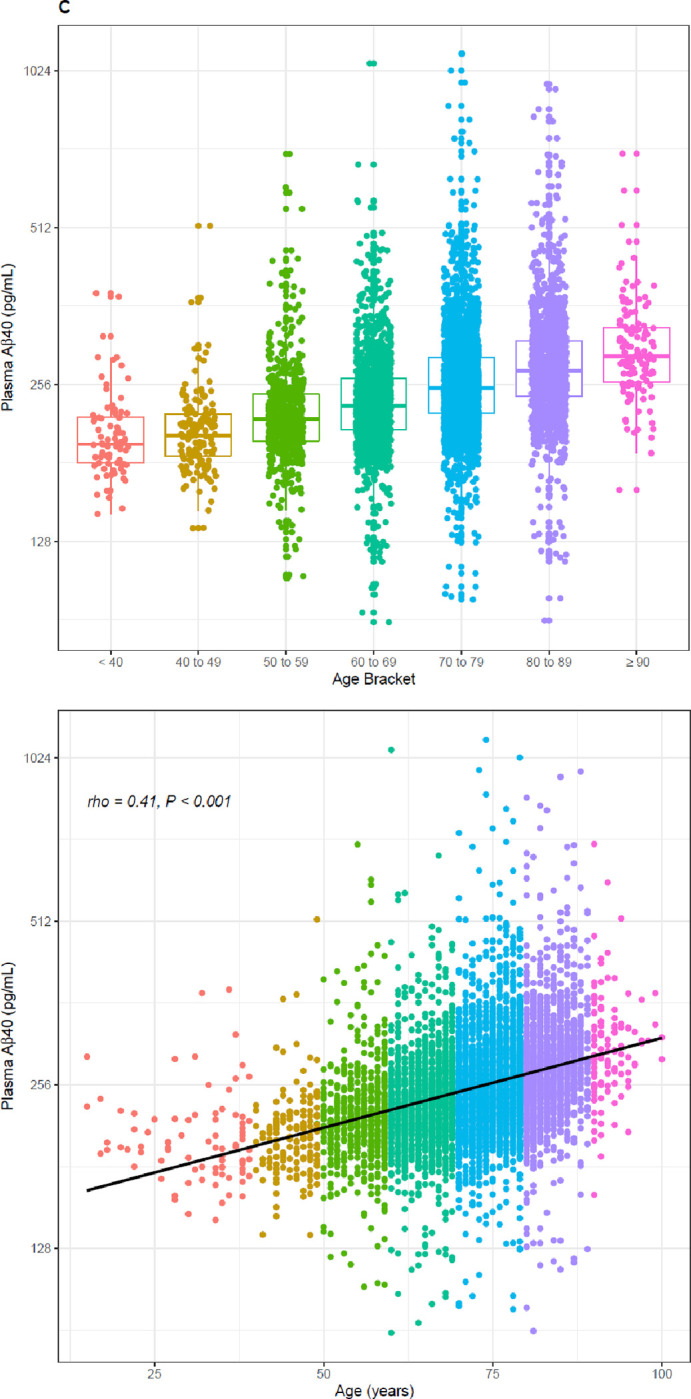
Distribution (upper) and scatterplots (lower, P <.001 for all) by age of; A) Aβ42/40 ratio, Spearman’s rho = −0.25, 95%CI, −0.27 to −0.22. B) Aβ42 concentrations, Spearman’s rho = 0.22, 95%CI 0.20 to 0.25; and C) Aβ40 concentrations, Spearman’s rho = 0.41, 95%CI 0.39 to 0.43. Black dashed line denotes Aβ42/40 ratio cutoff of 0.160. Red dashed lines denote Aβ42/40 ratio indeterminant risk cutoffs (0.150 and 0.170).