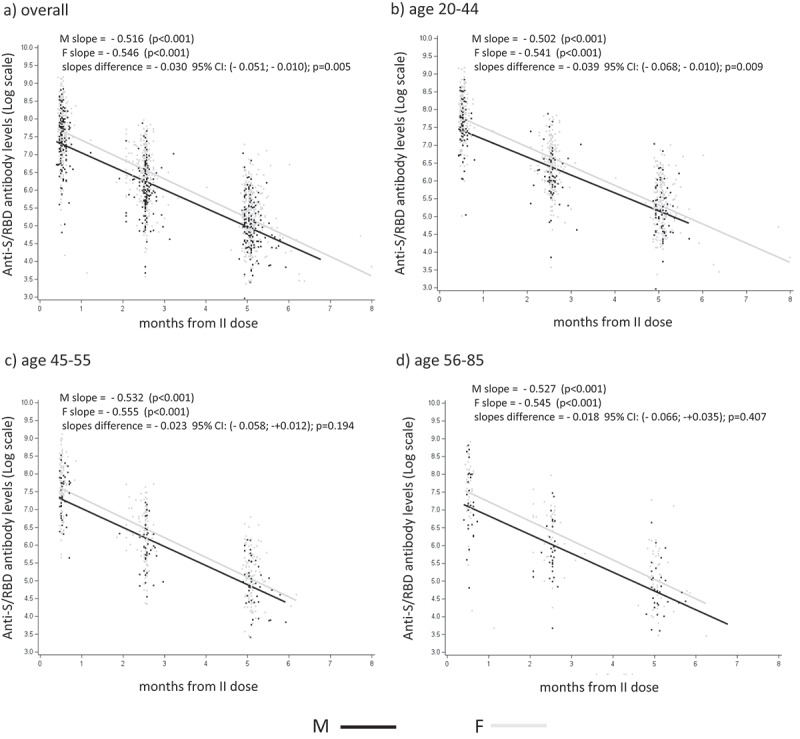
Figure 2.

Analysis of sex differences in anti-S/RBD waning. Scatters for the log values of anti-S/RBD antibody levels with the regression lines estimated using mixed regression model for males (M) and females (F), panel (a) all age groups; panel (b) 20–44 years; panel (c) 45–55 years; panel (d) 56–85 years; p-values relative to anti-S/RBD antibody slope differences in M vs F are shown in each panel.
