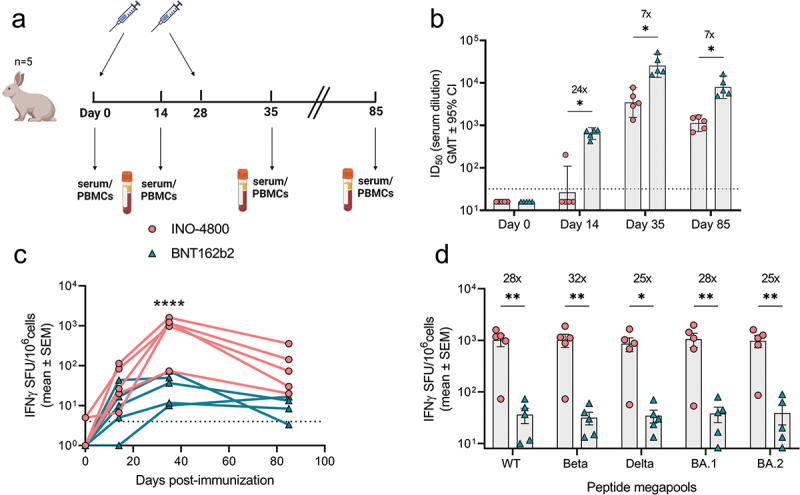
Figure 3.

Characterization of the immune response in New Zealand rabbits after a primary series of mRNA and DNA clinically relevant doses. (a) Study schematic25 and dosing schedule in New Zealand rabbits. (b) Neutralizing activity (ID50 values) against the WT pseudovirus for sera samples from Day 0, Day 14 and Day 35 are shown. Dashed lines represent the limit of detection (LOD) of the assay. Samples below LOD were plotted at the number equivalent to half of the lowest serum dilution. Data shown represent mean ID50 (GMT ± 95% CI) for each group of six rabbits. Numbers above bars represent GMT values and fold-change between treatments. (c-d) PBMC cellular responses to WT spike peptide megapool on (c) days 0, 14, 35 and 85 or (d) responses to WT, Beta, Delta, BA.1 and BA.2 variant spike megapools at Day 35 measured by IFNγ ELISpot assay. Numbers above bars represent fold-change between treatments for each variant. Data shown represent IFNγ spots per one million cells of experimental triplicates (mean ± SEM) after DMSO subtraction. (b-d) ****P < .0001, **P < .01, *P ≤ .05 (2-way ANOVA, sidak’s multiple comparison).
