Figure 1.
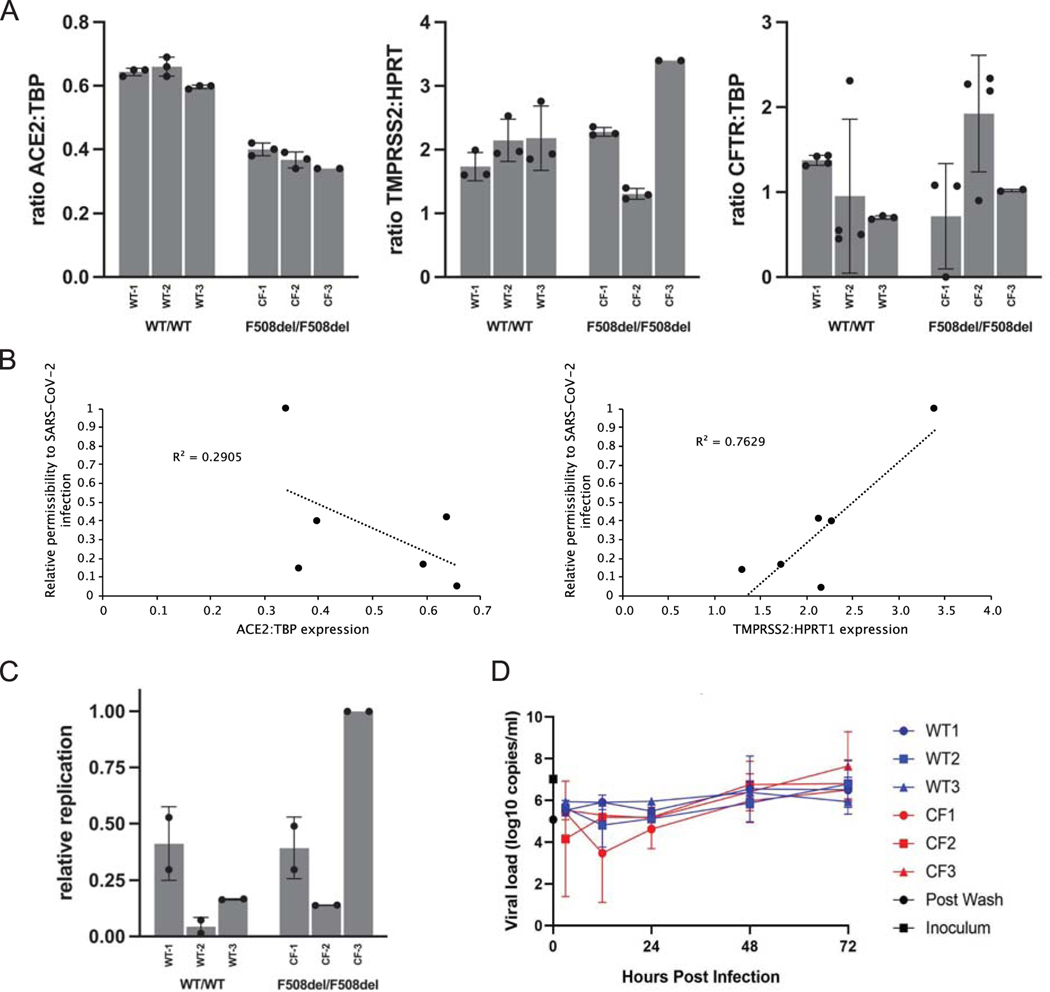
SARS-CoV-2 related features of primary human airway (bronchial) epithelium (hBEC) from three non-CF individuals or three patients with CF. Human primary cells were prepared as differentiated monolayers at air-liquid interface for each data point. (A) Quantitative analyses of ACE2, TMPRSS2, and CFTR expression in CF versus non-CF primary airway epithelia determined by ddPCR. Data is shown as the ratio of target gene expression to TBP or HPRT1 internal controls and calculated as mean +/− standard deviation (SD). Each bar represents 2–4 biological replicates per patient sample, with 2 ddPCR runs per replicate. (TMPRSS2 was normalized to HPRT1 due to expression at much higher levels than CFTR or ACE2 in primary airway epithelia.) For ACE2: CF vs. non-CF, p <0.0001; for TMPRSS2 and CFTR: CF vs. non-CF, p >0.05. (B) Correlation analysis between ACE2 and TMPRSS2 mRNA levels and SARS-CoV-2 replication. (C) hBEC monolayers were grown at air liquid interface and exposed to ~300 infectious units of SARS-CoV-2. Total RNA was harvested 48 h post infection and levels of SARS-CoV-2 RNA determined by RT-qPCR. Each bar represents a different individual with 2 biological replicates and 2 wells per repeat (4 wells total), with two duplicate qPCR samples per well (8 total qPCR values per bar). Propagation is expressed as viral RNA within cells, 48 h post infection, relative to sample CF-3 and normalized to RNaseP. Standard deviation bars are shown. Note that for certain points, error bars are shorter than height of symbols. (D) Virus replication kinetics in bronchial epithelial monolayers from three non-CF individuals and three individuals with CF were determined by inoculating separate monolayers with an MOI of 0.1 of SARS-CoV-2. Samples were collected from the apical surface at 3, 12, 24, and 48 h post infection. RNA was extracted and RT-qPCR performed to detect E gRNA. In each run, dilutions of counted RNA standards were run in parallel to calculate copy numbers in the samples. To confirm active virus, RT-qPCR was performed on the inoculum and immediately after removal of the wash. Data represent means and standard error of 4 replicate wells per donor per timepoint. Values of replication are variable between patient hBEC samples due to factors such as cell confluence, passage number, monolayer resistance, effects of genes other than CFTR, epistasis, etc. Differences between WT versus CF primary cells in (C) amount to modestly higher production of SARS-CoV-2 in the CF models, but overall (WT vs. CF) failed to reach statistical significance. CF samples in Figure 1D showed a maximal increase (peak value vs. 3-hour post inoculum timepoint) of 624-fold and non-CF samples showed a 370-fold increase.

