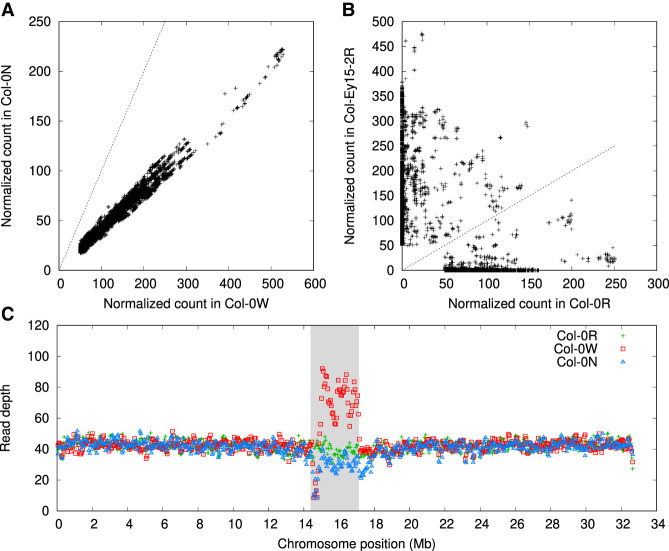
Figure 2.
Normalized counts of 179-mers in three A. thaliana read data sets. Raw 179-mer counts in reads are normalized by coverage. A 179-mer is selected in the plot if it matches the CEN180 satellite and if its normalized count is at least 50 in one of the data sets. (A) Counts between two different samples from the same strain. (B) Counts between two different strains. (C) Read depths averaged in 100 kb windows across Chromosome 1. The shaded area indicates the centromere enriched with the CEN180 satellite repeat.

