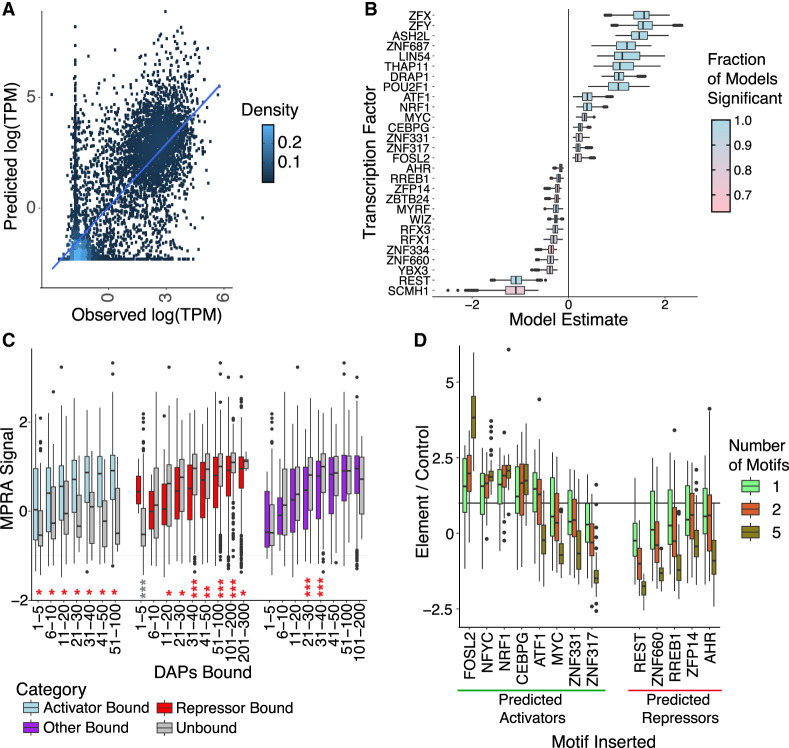
Figure 2.
Effects of specific TFs on gene expression and in MPRA assays. (A) Observed (x-axis) versus predicted (y-axis) natural log of gene expression as measured by transcripts per million (TPM). A linear model was constructed based on binding of TFs at a gene's TSS ±500 bp. Training and testing were performed on a 70%/30% split of all genes. Pearson's correlation = 0.77, P ≤ 2.2 × 10⁻¹⁶. Blue line was generated from geom_smooth in the ggplot2 package (Wickham 2009). (B) Box plot shows distribution of linear model estimates (x-axis) for select TFs (y-axis) from submodels. Five hundred submodels with unique subsets of randomized TFs (n = 79) were constructed for each TF, and estimates for the focal TF were recorded. Colors closer to blue indicate that the focal TF was significant in a higher proportion of submodels, and colors closer to pink indicate that the focal TF was significant in a lower proportion of submodels. For B–D, boxes represent 25%–75% quartiles with line indicating median, whiskers extend to ±1.5 × IQR (interquartile range) past the boxes, and points are observations falling outside of this range. (C) Boxes show MPRA signal (natural log of normalized RNA reads over normalized DNA reads; y-axis) as a function of binned number of DAPs (x-axis) for promoter regions either bound by one of the top factors identified in the linear model as an activator (blue), repressor (red) or randomly selected TF (purple), compared with regions that were not bound by one of those TFs for each group (gray), showing activating, repressing, and uncertain activity for each respective group of TFs, respectively. Unpaired t-tests were used to identify significant differences in the means between bound and unbound sequences in each group. (*) P = 0.05, (**) P = 0.0001, (***) P ≤ 2.2 × 10⁻¹⁶. (D) Boxes show MPRA signal as in C (y-axis) for motifs inserted into enhancer sequences at various intervals (x-axis). A group of candidate activators (x-axis; green line) and candidate repressors (x-axis; red line) was selected, and one (green), two (red), or five (brown) motifs were inserted. Control ratio was based on the sequence without any motif insertions. P-values for this figure are available in Supplemental Table 16.

