Figure 4.
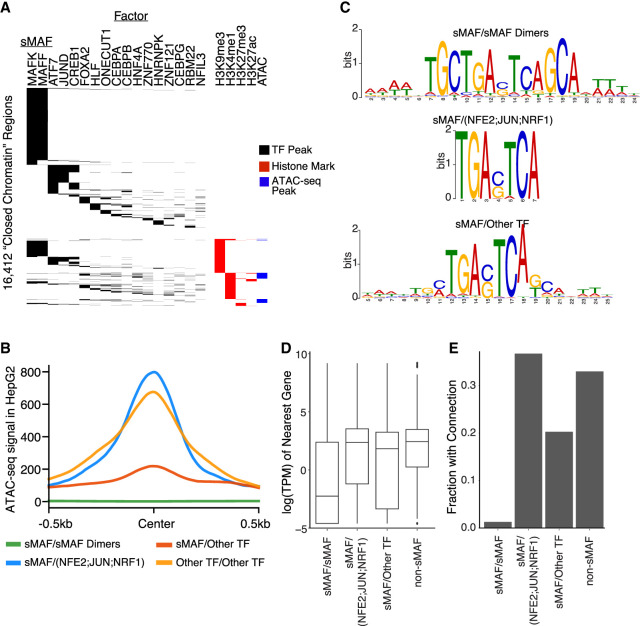
Small MAF (sMAF) proteins bind widely to non-cCRE regions in a sequence-directed manner and show widespread influence on nearby gene expression. (A) Heat map of non-cCRE regions with binding of various TF and histone marks. MAFF and MAFK show the largest degree of binding of any such mark. (B) ATAC-seq signal (y-axis) at regions bound by various TF dimer sets ±500 bp (x-axis). sMAF/sMAF (green) dimers show markedly lower ATAC-seq signal compared with other groups, and sMAF heterodimers with known activating cofactors (blue) show high openness. sMAF heterodimers with noncofactors (red) show minimal openness, and heterodimers made of other TFs (orange) show high but broad openness. (C) Motifs generated via MEME using regions bound by noted dimer sets. sMAF/sMAF dimers (top) show more flanking structure outside of the core MAF motif than do heterodimers of sMAF and non-sMAF proteins. (D) Box plot shows the distribution of natural log of expression levels as measured by TPM (y-axis) for genes closest to each putative dimer set (x-axis). Putative sMAF/sMAF dimers show much lower expression profiles than do other groups. Boxes represent 25%–75% quartiles with line indicating median, whiskers extend to ±1.5 × IQR (interquartile range) past the boxes, and points are observations falling outside of this range. (E) Bars show the fraction (y-axis) of putative dimer sets (x-axis) that have evidence for binding in a looped region, based on Hi-C data. sMAF/sMAF dimers show a significantly lower rate of binding in looped regions than do other dimer types.

