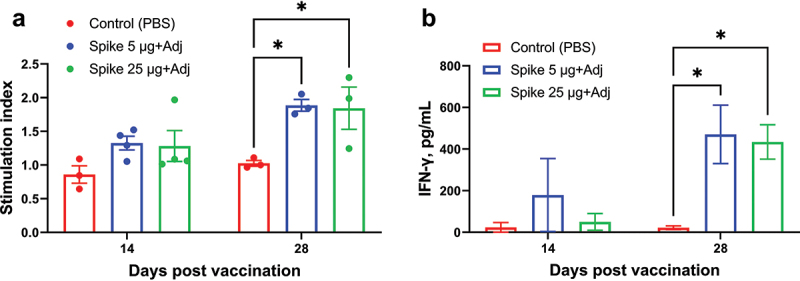
Figure 2.

Antigen-specific T cell proliferation (a) and IFN-γ production by peripheral blood mononuclear cells (b) from vaccinated and control macaques on days 14 and 28 of the experiment. The stimulation index was calculated as the difference (Δ) in the number of proliferating (CFSE+) T cells (CD3+) between rSpike-stimulated and non-stimulated cells. IFN-γ data are presented as concentration differences (pg/mL) between samples with and without stimulation with rSpike. Differences between groups were assessed using Tukey’s multiple comparisons test. P < 0.05 was considered significant. *P < 0.05.
