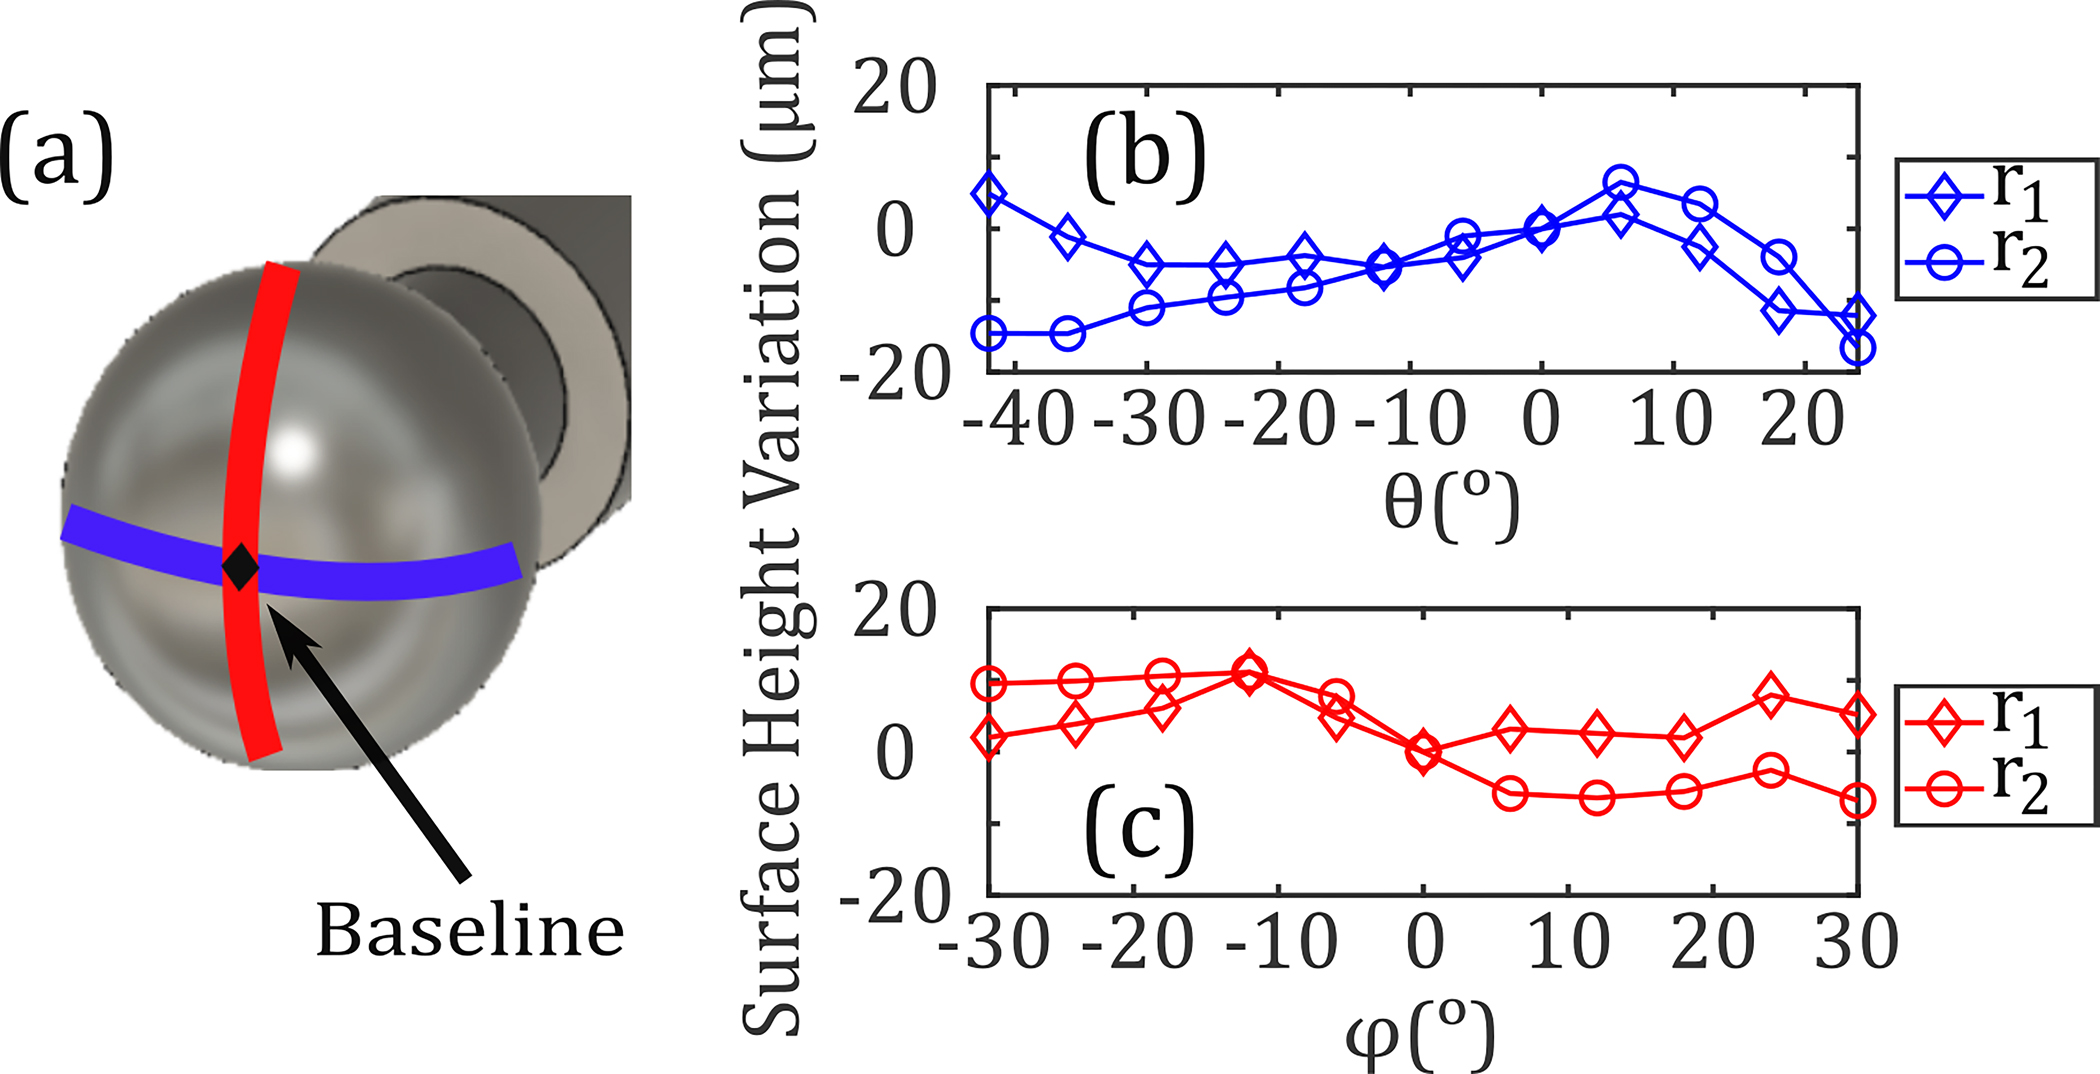
Fig. 4.

(a) Orthogonal (blue) and (red) equiangular scans along two stainless steel spheres with radii and are shown. The surface profiles along the (b) and (c) directions are plotted; the maximum deviation with respect to a baseline measurement obtained at was approximately 15 μm.
