

Abstract
Paternal genomes are compacted during spermiogenesis and decompacted following fertilization. These processes are fundamental for inheritance but incompletely understood. We analyzed these processes in the frog Xenopus laevis, whose sperm can be assembled into functional pronuclei in egg extracts in vitro. In such extracts, cohesin extrudes DNA into loops, but in vivo cohesin only assembles topologically associating domains (TADs) at the mid-blastula transition (MBT). Why cohesin assembles TADs only at this stage is unknown. We first analyzed genome architecture in frog sperm and compared it to human and mouse. Our results indicate that sperm genome organization is conserved between frogs and humans and occurs without formation of TADs. TADs can be detected in mouse sperm samples, as reported, but these structures might originate from somatic chromatin contaminations. We therefore discuss the possibility that the absence of TADs might be a general feature of vertebrate sperm. To analyze sperm genome remodeling upon fertilization, we reconstituted male pronuclei in Xenopus egg extracts. In pronuclei, chromatin compartmentalization increases, but cohesin does not accumulate at CTCF sites and assemble TADs. However, if pronuclei are formed in the presence of exogenous CTCF, CTCF binds to its consensus sites, and cohesin accumulates at these and forms short-range chromatin loops, which are preferentially anchored at CTCF's N terminus. These results indicate that TADs are only assembled at MBT because before this stage CTCF sites are not occupied and cohesin only forms short-range chromatin loops.
Sexually reproducing organisms pass their genetic information from one generation to the next by forming haploid sperm and egg cells, which fuse to form a diploid totipotent zygote (for reviews, see Vallot and Tachibana 2020; Deneke and Pauli 2021). Two key functions of sperm cells during this process are to activate embryonic development by fertilization and to restore ploidy in the zygote by contributing a haploid set of male chromosomes. For these purposes, male gametes differentiate into highly motile sperm cells (spermatozoa) that are morphologically and metabolically distinct from other cell types. Sperm cells display little if any transcriptional and translational activity (for review, see Steger 1999), contain little cytoplasm, develop “tail” structures that enable the cells to swim, and have small nuclei. The formation of small nuclei is thought to facilitate sperm swimming (for review, see Balhorn 2007) and require an exceptionally high degree of DNA compaction, which exceeds that observed in mitotic cells (Pogany et al. 1981; for review, see Ward and Coffey 1991). However, how genomic DNA is folded in sperm is much less well understood than genome architecture in somatic cells.
In somatic interphase cells, DNA folding occurs at multiple levels. The 2-nm DNA double helix is wrapped around histone octamers, leading to the formation of 10-nm nucleosomal chromatin fibers (Kornberg 1974; Olins and Olins 1974). These can be folded by cohesin, a member of the “structural maintenance of chromosomes” (SMC) family of ATPases. In vitro, cohesin can fold DNA by extruding loops (Davidson et al. 2019; Kim et al. 2019; Golfier et al. 2020), suggesting that these complexes also form chromatin loops by extrusion in cells. Chromatin loops formed by cohesin typically contain a few 100 kb of DNA (median, 270 kb in human cells) (Rao et al. 2017; Wutz et al. 2017) and have been implicated in chromatin assembly, gene regulation, recombination, and timing of DNA replication (for review, see Davidson and Peters 2021). In single cells, chromatin loops can be detected at variable positions (Flyamer et al. 2017; Beckwith et al. 2021; Gabriele et al. 2022), but in large cell populations, the superimposition of individual loops reveals the existence of topologically associating domains (TADs), within which these loops occur (Dixon et al. 2012; Nora et al. 2012). The boundaries of TADs depend on CTCF, a DNA-binding protein that associates with specific consensus sequences located at these boundaries (Nora et al. 2017; Wutz et al. 2017). CTCF is thought to establish TAD boundaries by constraining cohesin-mediated loop extrusion in an orientation-dependent manner, thus limiting the length of chromatin loops that can be formed by cohesin (Rao et al. 2014; de Wit et al. 2015; Nichols and Corces 2015; Sanborn et al. 2015; Vietri Rudan et al. 2015; Fudenberg et al. 2016). This hypothesis is supported by the observation that the accumulation of cohesin and of cohesin-mediated chromatin loops at TAD boundaries depends on CTCF (Wendt et al. 2008; Busslinger et al. 2017; Nora et al. 2017; Wutz et al. 2017) and that single CTCF molecules are sufficient to block cohesin-mediated DNA loop extrusion in an orientation-dependent manner in vitro (Davidson et al. 2023; Zhang et al. 2023). Over longer distances, spanning several megabases of DNA, chromatin regions are further separated into transcriptionally active A and transcriptionally less active B compartments, which correspond to euchromatic and heterochromatic regions (Lieberman-Aiden et al. 2009; Rao et al. 2014; Nagano et al. 2017). Chromatin compartmentalization does not depend on cohesin-mediated loop extrusion and, to the contrary, is partially suppressed by this process (Gassler et al. 2017; Rao et al. 2017; Schwarzer et al. 2017; Wutz et al. 2017).
During chromosome condensation in mitosis and meiosis, nucleosomal chromatin fibers persist, although the posttranslational modification state of their histone subunits is altered by protein kinases and histone deacetylases, which contribute to chromosome compaction (Hirota et al. 2004; Fischle et al. 2005; Wilkins et al. 2014). Cohesin is released in a step-wise manner from mitotic chromosomes (Waizenegger et al. 2000), presumably resulting in loss of the loops formed by cohesin, and cohesin is replaced by the related SMC complexes condensin I and II (Ono et al. 2003; Yeong et al. 2003; Hirota et al. 2004; Gerlich et al. 2006). Condensin II extrudes DNA into loops that are longer (median size, 400 kb) (Gibcus et al. 2018) than those formed by cohesin in interphase, whereas condensin I generates shorter nested loops inside the condensin II loops (median size, 80 kb) (Gibcus et al. 2018), and compartments become undetectable (Naumova et al. 2013; Gibcus et al. 2018). Most, but not all, CTCFs dissociate from mitotic chromosomes (Wendt et al. 2008; Cai et al. 2018; Oomen et al. 2019), and the loops extruded by condensin complexes are not patterned by TAD boundaries and are instead even more asynchronously distributed in individual cells than loops in interphase. During exit from mitosis, these processes are reversed, leading to the re-formation of TADs and compartments (Abramo et al. 2019; Zhang et al. 2019).
Chromosome compaction in sperm differs from mitotic and meiotic chromosome condensation because most nucleosomes are replaced by protamines during spermiogenesis, leaving only 1%–15% of the mammalian sperm genome associated with nucleosomes (for review, see Le Blévec et al. 2020). Protamines create a unique toroid chromatin structure, in which DNA is compacted (Hud et al. 1993). Whether these toroid structures can be further extruded into loops by SMC complexes is unknown, and previous studies have come to different conclusions about how sperm DNA is organized at higher levels. Several studies performed in mice (Battulin et al. 2015; Du et al. 2017; Jung et al. 2017, 2019; Ke et al. 2017; Luo et al. 2020) and one in rhesus monkeys (Macaca mulatta) (Wang et al. 2019) reported the presence of chromatin loops (visible as “corner peaks” in Hi-C maps), which were confined by TAD boundaries. Compartments were also detected in these experiments. Based on these observations, it has been proposed that genome organization in murine and monkey sperm is similar to that in somatic cells, despite the replacement of nucleosomes by protamines in these cells (Battulin et al. 2015; Du et al. 2017; Jung et al. 2017, 2019; Ke et al. 2017; Wang et al. 2019; Luo et al. 2020). However, another study did not detect TADs and detected only coarse compartments in mouse sperm (Vara et al. 2019), and similar results were obtained in a study on human sperm (Chen et al. 2019; Supplemental Table S1). Whether these differences are owing to technical variation or species differences is unknown.
Upon formation of the zygote by fertilization, the paternal genome initially remains in the sperm nucleus, which has entered the egg during fertilization, but inside this male pronucleus, protamines are rapidly replaced by histones (for review, see Rankin 2019). In mouse zygotes, the resulting nucleosomal chromatin fibers are extruded into loops by cohesin (Gassler et al. 2017), and weak TAD structures can be detected (Flyamer et al. 2017). In most species, TAD strength increases during early embryogenesis and reaches somatic levels only during zygotic genome activation (ZGA) (Supplemental Table S1; for review, see Vallot and Tachibana 2020).
It is unknown why, in most species, TADs are only fully assembled during early development. In Xenopus laevis egg extracts, cohesin can extrude DNA into loops (Golfier et al. 2020), yet in the closely related frog Xenopus tropicalis, TADs can only be detected when ZGA occurs during the mid-blastula transition (MBT) (Niu et al. 2021). To address why TADs cannot be assembled before MBT, we have measured genome architecture in X. laevis sperm and analyzed how this is remodeled during formation of pronuclei in egg extracts. We have also compared Xenopus sperm with sperm from humans and mice to address whether the detectability of TADs in these samples could be explained by species differences or by differences in the sperm isolation procedures used.
Results
The frog (X. laevis) sperm genome is folded into long-range cis interactions, which are not constrained by TAD boundaries
We measured chromosomal cis interactions in X. laevis sperm to determine how the male genome is packaged in these cells and to later be able to analyze how genome architecture is remodeled during pronuclear assembly in Xenopus egg extracts. For this purpose, we isolated Xenopus sperm by density gradient centrifugation (Supplemental Fig. S1A) and measured chromatin interactions genome-wide by Hi-C. For comparison, we also measured chromatin interactions in the somatic X. laevis cell line XL-177 (Fig. 1A,B).
Figure 1.

The frog sperm genome is organized without TADs and corner peaks. (A) Contact frequency as a function of genomic distance for Xenopus laevis (frog) sperm enriched by density gradient centrifugation (DGC) compared with frog XL-177 cells. (B) Normalized Hi-C matrices for the same samples as in A in the region of Chr1S:55–65 Mb at 25-kb resolution. (C) Number of TADs called for the same samples as in A. (D) Aggregate contact frequencies (coverage and distance corrected) around the 135 550- to 650-kb-long TADs called in XL-177 cells, for the same samples as in A. (E) Number of corner peaks called for the same samples as in A. (F) Aggregate contact frequencies (coverage and distance corrected) around the 109 550- to 650-kb-long corner peaks called in XL-177 cells, for the same samples as in A. (G) Normalized Hi-C matrices for the same samples as in A in the region of Chr3L:70–150 Mb at 100-kb resolution. (H) Compartment tracks from principal component analysis for the same samples as in A. (I) The autocorrelation of the PC1 value as a function of genomic distance, for the same samples as in A.
Hi-C contacts in XL-177 cells showed a distribution of genomic distances (Fig. 1A) and TAD and corner peak patterns typical for somatic cells (TADs appear as pyramid-shaped structures in Hi-C maps, and corner peaks as dots at the apex of these TADs) (Fig. 1B). In contrast, genomic interactions in Xenopus sperm were depleted in contacts <1 Mb, namely, in the size range in which TADs are found, and instead were enriched in contacts >1 Mb, with a peak at ∼2–3 Mb (Fig. 1A). Correspondingly, no TADs and corner peaks could be detected in the Xenopus sperm Hi-C maps by visual inspection (Fig. 1B). TAD calling by HOMER (Heinz et al. 2010) identified a few TAD-like structures (Supplemental Table S2), but these were unusually small (median size, 75 kb). Based on visual inspection and their unusually small size, we suspect that these TAD-like structures represent false-positive artifacts of the calling algorithm. In contrast, HOMER detected 2500 regularly sized TADs in XL-177 cells (median size, 295 kb) (Fig. 1C; Supplemental Fig. S1B). When we used the coordinates of these somatic TADs for aggregate peak analysis, we could also not detect contact enrichment in the sperm Hi-C data (Fig. 1D; Supplemental Fig. S1C). Similarly, no canonical corner peaks could be detected in the sperm data by visual inspection (Fig. 1B) or by JuicerTools (Supplemental Table S2; Durand et al. 2016). In contrast, 5832 corner peaks with a median size of 275 kb could be identified in XL-177 cells, (Fig. 1E; Supplemental Fig. S1D). This difference in corner peak number was not owing to differences in unique read counts because after down-sampling the XL-177 data to the number of unique read counts obtained from Xenopus sperm, 4170 corner peaks were still detected in the XL-177 data (Supplemental Table S2). Aggregate peak analysis did also not detect contact enrichment in sperm samples around the corner peaks called in the XL-177 data set (Fig. 1F; Supplemental Fig. S1E). These results suggest that the Xenopus sperm genome forms chromatin interactions that, on average, are longer than those observed in somatic interphase cells (Fig. 1A) but that are not anchored at CTCF sites and not organized in TADs.
In contrast, A and B compartments could be detected in Xenopus sperm, although the “checkerboard” pattern that is characteristic for these structures was much less pronounced than that in XL-177 cells (Fig. 1G). To quantify this difference, we performed principal compartment analysis using HOMER. This revealed the presence of longer compartment regions with less frequent switching of the compartment state in Xenopus sperm than in XL-177 cells (Fig. 1H). This difference is captured by the slower decay of the autocorrelation function of the compartment signal; although the compartment signal of genomic regions that are separated by >5 Mb are not correlated in XL-177 cells (the autocorrelation is ∼0), even genomic regions that are as far apart from each other as 10 Mb are still correlated in sperm (Fig. 1I). These results suggest that a crude compartmentalization is preserved when chromatin is packaged into Xenopus sperm but that the precise patterns of these structures are lost during this process, as are corner peaks and TAD boundaries.
The genome architecture of Xenopus sperm is similar to that of human sperm
Our Hi-C data obtained with Xenopus sperm resemble those published for human sperm, in which TADs could also not be detected (Chen et al. 2019). However, our results differ from those reported for sperm from rhesus monkeys (Wang et al. 2019) and mice (Battulin et al. 2015; Du et al. 2017; Jung et al. 2017, 2019; Ke et al. 2017; Luo et al. 2020), in which TADs were observed. A different situation was found by Vara et al. (2019), who did not detect TADs in mouse sperm but observed coarse compartments with less frequent switching of the compartment state, similar to what we had found in Xenopus sperm. This variability is unexpected because in somatic cell types, genome organization and TAD boundaries are highly conserved among vertebrate species (Vietri Rudan et al. 2015; Li et al. 2022). We therefore reanalyzed human and mouse sperm samples by using the same Hi-C approach that we had used for Xenopus sperm to be able to directly compare sperm genome architecture between these species. In case of human sperm, we also performed these experiments because genome organization in human sperm had only been analyzed in a single study so far (Chen et al. 2019), despite its potential importance for reproductive medicine.
We isolated human sperm from ejaculate using density gradient centrifugation with >97% purity (Supplemental Fig. S2A,B), measured chromatin interactions genome-wide by Hi-C, and compared them with published chromatin interactions in the human fetal lung fibroblast cell line IMR-90 (Rao et al. 2014) as a somatic interphase control (Fig. 2A,B). As in Xenopus sperm, genomic interactions in human sperm were depleted in contacts <1 Mb, namely, in the size range in which TADs are found, and instead were enriched in the 1- to 10-Mb region with a peak at ∼3 Mb (Fig. 2A). Correspondingly, no TADs and corner peaks could be detected in the human sperm Hi-C maps by visual inspection (Fig. 2B). TAD calling by HOMER identified only a few unusually small putative TAD-like structures in human sperm (median size, 65 kb), compared with 2178 TADs in IMR-90 cells (median size, 385 kb) (Fig. 2C; Supplemental Fig. S2C), which might represent false-positive artifacts of the calling algorithm. Consistent with this interpretation, we could not detect contact enrichment in human sperm by aggregate analyses in which the genomic coordinates of TADs identified in IMR-90 cells were used (Fig. 2D; Supplemental Fig. S2D). Similarly, only very few putative corner peaks with an unusual median size of 650 kb (compared with 6120 in IMR-90 cells with a median size of 250 kb) could be detected in human sperm by JuicerTools (Fig. 2E; Supplemental Fig. S2E; Supplemental Table S2). Contact enrichment could also not be detected in human sperm by aggregate peak analysis when we used the coordinates of corner peaks that were identified in IMR-90 cells (Fig. 2F; Supplemental Fig. S2F), suggesting that the putative peaks detected by JuicerTools in the sperm Hi-C data are calling artifacts.
Figure 2.

The human sperm genome is organized without TADs and corner peaks. (A) Contact frequency as a function of genomic distance for human sperm enriched by DGC and swim-up compared with human IMR-90 cells by Rao et al. (2014). (B) Normalized Hi-C matrices for the same samples as in A in the region of Chr3:67–77 Mb at 25-kb resolution with TAD calling indicated using black lines. (C) Number of TADs called for the same samples as in A. (N.A.) Artifacts in TAD calling owing to low sequencing depth. (D) Aggregate contact frequencies (coverage and distance corrected) around the 138 550- to 650-kb-long TADs called in IMR-90 cells, for the same samples as in A. (E) Number of corner peaks called for the same samples as in A. (F) Aggregate contact frequencies (coverage and distance corrected) around the 249 550- to 650-kb-long corner peaks called in IMR-90 cells, for the same samples as in A. (G) Normalized Hi-C matrices for the same samples as in A in the region of Chr3:0–90 Mb at 250-kb resolution. (H) Compartment tracks from principal component analysis for the same samples as in A. (I) The autocorrelation of the PC1 value as a function of genomic distance, for the same samples as in A.
Only weak compartmentalization could be detected in human sperm (Fig. 2G), in contrast to IMR-90 cells, in which strong compartments exist. The compartment signals in human sperm were more pronounced than in Xenopus sperm samples but, like in these, contained long regions and infrequent compartment switching (Fig. 2H). As in Xenopus sperm, the autocorrelation function of compartments in human sperm decayed much more slowly than in IMR-90 cells, with genomic regions spanning >10 Mb still being correlated (Fig. 2I). These results confirm that genome organization in human sperm is similar to the situation in frog sperm.
The genome organization of human sperm is independent of the sperm isolation method
Because our study and a previous study (Chen et al. 2019) did not detect chromatin loops and TADs in human sperm whereas other studies had reported such structures in sperm from mice and monkeys, we addressed whether these differing results could be explained by technical differences in the approaches used.
To explore this possibility, we first analyzed mouse sperm samples with the same Hi-C protocol that we had used for human sperm, except that we isolated mouse sperm from cauda epididymides using a swim-up assay (Supplemental Fig. S3A–D). Unlike in human sperm, we identified almost as many TADs and corner peaks in the mouse sperm samples as in the somatic mouse lymphoma cell line CH12.LX, although the sperm sample TADs were considerably smaller (median size, 95 kb) than TADs in CH12.LX cells (median size, 305 kb) (Supplemental Fig. S3E,F,I,J). Aggregate contact enrichment analysis using coordinates from CH12.LX cells confirmed the presence of TADs and corner peaks in mouse sperm samples, although both were weaker than those in somatic cells (Supplemental Fig. S3G,H,K,L). Compartments were similar between mouse sperm samples and CH12.LX cells, showing comparable patterns and autocorrelation functions (Supplemental Fig. S3M–O) and no long-range (>10-Mb) correlation (Supplemental Fig. S3O), in contrast to what we observed in human sperm. These results indicate that differences between human and mouse sperm Hi-C data cannot be attributed to variations in the Hi-C protocol used.
Next, we analyzed whether differences in the final steps of the sperm isolation procedures could contribute to the observed differences between human and mouse sperm Hi-C data, for example, because different methods might affect to which extent only mature sperm cells are isolated. We noticed that in all studies in which TADs had been detected in mammalian sperm, these cells had been isolated by “swim-up” procedures, either from the rhesus monkey (Wang et al. 2019) or from mice (this study; Battulin et al. 2015; Du et al. 2017; Jung et al. 2017, 2019; Ke et al. 2017; Luo et al. 2020). In contrast, for analyses that had not detected TADs, other isolation methods had been used, either FACS in case of mouse sperm (Vara et al. 2019) or density gradient centrifugation in case of human sperm (this study). To test whether the sperm isolation method could influence the results obtained in Hi-C experiments, we isolated human sperm in a swim-up procedure with a purity of >97% (Supplemental Fig. S2B). These experiments revealed that the genome organization of human sperm enriched via “swim-up” was indistinguishable from the genomic organization of sperm isolated by density gradient centrifugation. The two data sets were similar in all examined aspects, including cis/trans interaction ratios (Supplemental Table S2), distance-dependent interaction frequency patterns (Fig. 2A), corner peaks, TADs, and compartments. As observed for human sperm enriched by density gradient centrifugation, sperm samples enriched by swim-up lacked corner peaks and TADs (Fig. 2B–F; Supplemental Fig. S2C–F) but contained crude compartments showing long compartmental regions with infrequent switching between A and B types (Fig. 2G–I). These results suggest that the sperm isolation method does not impact the genome organization patterns that can be detected by Hi-C. However, it is important to note that human sperm was isolated from ejaculate and mouse sperm from the cauda epididymis. It is therefore possible that the initial source of the sperm contributes to the differences between human and mouse sperm samples observed by Hi-C.
Finally, we tested whether TADs and corner peaks could be detected in mouse sperm samples because these were contaminated with somatic cells. For this purpose, we performed in silico mixing of varying percentages of mouse sperm Hi-C data from the study by Vara et al. (2019), in which no corner peaks or TADs had been detected, with CH12.LX somatic cell Hi-C data to simulate somatic contamination. We then analyzed cis/trans interaction ratios, corner peaks, TADs, and compartments in these mixed data sets. This analysis indicated that ∼50% contamination is necessary to introduce somatic features into the Hi-C data set from Vara et al. (2019) (Supplemental Fig. S4A,B; Supplemental Table S3). Thus, because >96% of cells in our mouse samples were spermatozoa (Supplemental Fig. S3B) and similar degrees of purity were reported by others (Battulin et al. 2015; Du et al. 2017; Jung et al. 2017, 2019; Ke et al. 2017; Luo et al. 2020), contaminations with somatic cells cannot explain why most studies detected corner peaks and TADs in mouse sperm samples. However, a recent study by Oliver Rando and colleagues (Yin et al. 2023) revealed that mouse sperm samples are frequently contaminated with small amounts of cell-free chromatin from somatic cells, which cannot be detected by differential interference contrast (DIC) microscopy. In Hi-C experiments predominantly this contamination is detected, unless mouse sperm samples are treated with DTT to reduce disulfide bridges between protamines (Yin et al. 2023). It is therefore possible that the corner peaks and TADs in our mouse sperm Hi-C data originated from a similar contamination (see Discussion).
Male pronuclei assembled in Xenopus egg extracts form compartments but no TADs
To analyze how genome organization in sperm is remodeled following fertilization, we compared genome architecture of frog sperm before and after incubation in cell-free interphase extracts of X. laevis eggs. These extracts can recapitulate numerous cellular processes (Murray 1991), including formation of functional cell pronuclei around demembranated sperm DNA (Dasso and Newport 1990) and chromatinization of sperm DNA by protamine release and nucleosome assembly (for review, see Rankin 2019).
To generate male Xenopus pronuclei, we incubated demembranated frog sperm (Supplemental Fig. S1A) in Xenopus egg extract for 60 min (pronuclei 60′) or 140 min (pronuclei 140′) (Supplemental Fig. S5A) and measured chromatin interactions genome-wide by Hi-C. As observed for membranated frog sperm (Fig. 1A), demembranated sperm was depleted of contacts <1 Mb and enriched in longer contacts with a peak at ∼3–4 Mb (Fig. 3A), and no TADs and corner peaks could be observed by visual inspection (Fig. 3B).
Figure 3.

Demembranated frog sperm is remodeled upon incubation in egg extract. (A) Contact frequency as a function of genomic distance for demembranated frog sperm, demembranated frog sperm in Xenopus egg extract after 60 min (pronuclei 60′) or 140′ (pronuclei 140′), pronuclei 140′ with addition of 50 nM CTCF protein, and frog XL-177 cells. (B) Normalized Hi-C matrices for the same samples as in A in the region of Chr1S:25–35 Mb at 25-kb resolution. (C) Number of TADs called for the same samples as in A. (D) Normalized Hi-C matrices for the same samples as in A in the region of Chr3L:70–150 Mb at 100-kb resolution. (E) Normalized Hi-C matrices for three of the samples in A in the region of Chr1S:0–75 Mb at 100-kb resolution. (F) The autocorrelation of the PC1 value as a function of genomic distance, for the same samples as in A. (G) Compartment tracks from principal component analysis for the same samples as in A. (H) Immunoblotting of chromatin isolated from pronuclei 60′, with or without sperm, in comparison with chromatin fractioning (whole cell extract, supernatant, chromatin pellet) of XL-177 cells.
After incubation in egg extract, genomic contacts in the 2- to 10-Mb size were reduced and short contacts with a peak at ∼100 kb were increased (Fig. 3A). However, the resulting contact frequency distribution observed in pronuclei still differed from the distribution observed in XL-177 cells, in which long-range contacts are enriched in the TAD range, with a peak at ∼300 kb (Fig. 3A). Correspondingly, neither TADs nor corner peaks could be detected in pronuclei by visual inspection (Fig. 3B), and only very few putative TAD-like structures could be called genome wide by HOMER (median size, 775 kb after 60 min) (Fig. 3C; Supplemental Fig. S5C). There was also no or only very little contact enrichment detectable at TAD positions identified in XL-177 cells (Supplemental Fig. S5D,E). Similarly, only relatively few and exceptionally large corner peaks could be called in the pronuclei Hi-C data (Supplemental Table S2), compared with 5832 corner peaks with a median size of 275 kb in XL-177 cells (Supplemental Fig. S5B,F). Likewise, no contact enrichment could be detected in pronuclei at the position of corner peaks identified in XL-177 cells (Supplemental Fig. S5G,H). The putative TAD-like structures and corner peaks identified algorithmically in pronuclei might therefore represent technical artifacts. We suspect that at least some of these are caused by inaccuracies in the assembly of the pseudotetraploid X. laevis genome, which is less well established than assemblies of the diploid mouse and human genomes.
The absence of detectable canonical TADs and corner peaks could indicate either that these structures had not been formed in pronuclei assembled in Xenopus egg extracts or that Hi-C experiments cannot reliably detect long-range chromatin interactions in these extracts. For example, the high protein concentration of these extracts (∼50 mg/mL) (Murray 1991) could reduce the efficiency of formaldehyde-based cross-linking with which long-range DNA interactions are detected. To rule out this possibility, we isolated nuclei from XL-177 cells, cross-linked these in either Xenopus egg extract or PBS, and performed Hi-C. The two resulting data sets were similar in all parameters analyzed, including cis/trans interaction ratios, distance-dependent cis interaction frequency patterns, numbers and sizes of TADs, and numbers and sizes of corner peaks. Compartment strength was also similar (Supplemental Fig. S5I–K; Supplemental Tables S2, S4). These results show that our Hi-C protocol can detect TADs and corner peaks in nuclei in Xenopus egg extracts. The undetectability of these genomic structures in pronuclei thus indicates that TADs and corner peaks are not efficiently formed in pronuclei assembled in Xenopus egg extracts.
In contrast, compartments were present in pronuclei, further supporting the notion that long-range chromosomal cis interactions can be detected by Hi-C in Xenopus egg extracts. The compartment signals were stronger in pronuclei than the very weak signals observed in sperm, in particular after 140 min of incubation in egg extracts (Fig. 3D,E). Compartments also changed qualitatively, with pronuclei containing shorter regions than sperm, which is reflected in both their compartment signals and autocorrelation functions (Fig. 3F,G). Compartmentalization is therefore increased when sperm DNA is chromatinized and assembled into pronuclei in Xenopus egg extracts.
In Xenopus pronuclei, most CTCF sites appear not to be occupied by CTCF
TAD formation depends on the formation of chromatin loops by cohesin and the establishment of TAD boundaries by CTCF (Gassler et al. 2017; Nora et al. 2017; Rao et al. 2017; Schwarzer et al. 2017; Wutz et al. 2017). To understand why no TADs were detected in pronuclei, we analyzed whether these proteins are present on chromatin assembled in Xenopus egg extract. In immunoblotting experiments, the cohesin subunits Smc3 and Stag1 could be detected on sperm chromatin at levels that were higher than those on XL-177 chromatin (as judged by comparison to the levels of histone H3) (Fig. 3H), indicating that the number of cohesin complexes on sperm chromatin would principally be sufficient for TAD formation.
We were unable to identify antibodies that specifically recognized Xenopus CTCF (Supplemental Fig. S6A) and could therefore not analyze whether CTCF is present in Xenopus egg extracts and on sperm chromatin. However, chromatin immunoprecipitation sequencing (ChIP-seq) experiments using Smc3 antibodies suggest indirectly that CTCF might only be present on sperm chromatin in limiting amounts. These experiments identified only 9841 Smc3 peaks in pronuclei assembled in Xenopus egg extracts, but 56,653 in XL-177 cells (Fig. 4A–D; Supplemental Fig. S7D–F; Supplemental Table S5). One potential explanation for this difference could be that not all CTCF binding sites in Xenopus pronuclei are occupied by CTCF and that cohesin does therefore not accumulate at these sites. To test this possibility, we assembled pronuclei in Xenopus egg extracts, which we had supplemented with recombinant purified CTCF protein.
Figure 4.

Addition of recombinant CTCF to Xenopus pronuclei repositions cohesin. (A) Anti-Smc3 and anti-CTCF ChIP-seq tracks of demembranated frog sperm in Xenopus egg extract after 140 min (pronuclei 140′), pronuclei 140′ with addition of 50 nM CTCF protein, and frog XL-177 cells in the region of Chr6L:52.94–53.05 Mb. Pronuclei 140′ and pronuclei 140′ +CTCF data sets were obtained in a calibrated ChIP-seq experiment. (B) For pronuclei 140′ and pronuclei 140′ with addition of 50 nM CTCF protein, heat maps showing Smc3 enrichment over all Smc3 binding sites detectable in any of the two data sets, binding sites with Smc3-CTCF colocalization, and Smc3 binding sites that do not colocalize with CTCF, sorted by strength. (C) For pronuclei 140′, pronuclei 140′ with addition of 50 nM CTCF protein, and XL-177 cells, heat maps showing Smc3 enrichment over Smc3 binding sites in XL-177 cells, sorted by strength. (D) Venn diagrams showing the overlap of called Smc3 or CTCF binding sites for the same samples as in A, as well as CTCF binding motifs detected algorithmically on a genomic level, with numbers of shared and nonshared sites indicated below each Venn diagram. (E) Distribution of genomic distances between neighboring CTCF binding sites for pronuclei 140′ with addition of 50 nM CTCF protein compared with mouse MEF cells by Busslinger et al. (2017), shown using box plots with the internal distribution overlaid. Genomic distances are scaled with log10. Continuous white lines represent medians; dashed white lines represent averages. (F) Distribution of genomic distances between neighboring Smc3 binding sites for pronuclei 140′, pronuclei 140′ with addition of 50 nM CTCF protein, XL-177 cells, and mouse MEF cells, shown using box plots with the internal distribution overlaid. Genomic distances are scaled with log10. Continuous white lines represent medians; dashed white lines represent averages.
We used human CTCF for these experiments because specific antibodies to human CTCF are available, because human CTCF shares ∼87% sequence identity with X. laevis CTCF (Supplemental Fig. S6B,C), and because human CTCF can bind to sperm chromatin in Xenopus egg extracts (Supplemental Fig. S7A,C). After the addition of 50 nM purified human CTCF (Davidson et al. 2016), ChIP-seq experiments identified 106,961 CTCF peaks (Fig. 4A; Supplemental Table S5). This number did not increase when more CTCF was added (99,758 peaks were detected in the presence of 123 nM CTCF) (Supplemental Fig. S7F; Supplemental Table S5), indicating that 50 nM CTCF was sufficient to occupy the majority of accessible CTCF binding sites in Xenopus sperm chromatin. This concentration is in the same range as the nuclear CTCF concentration that has been reported for mammalian cultured cells (144.3 nM in U2OS cells) (Cattoglio et al. 2019), as is the number of CTCF ChIP-seq peaks called in our experiments compared with those reported for mammalian cells (73,984 peaks in MCF-7 cells) (Schmidt et al. 2012). De novo motif analysis of the CTCF binding sites detected by ChIP-seq in Xenopus pronuclei identified consensus motifs for CTCF and its testis-specific paralog CTCFL as the two most significant hits (Supplemental Table S6). Analysis of the X. laevis genome assembly 9.2 for the presence of CTCF consensus motifs and comparison of these to the CTCF ChIP-seq peaks revealed a high degree of overlap between these (Fig. 4D). Furthermore, the distribution of genomic distances between CTCF ChIP-seq peaks identified in Xenopus pronuclei and in mouse embryonic fibroblasts (MEFs) was very similar (Fig. 4E). These results indicate that human CTCF can bind to bona fide CTCF sites in Xenopus sperm chromatin.
Under these conditions, cohesin could also be detected at numerous sites at which cohesin was undetectable in the absence of CTCF (Fig. 4A–C; Supplemental Fig. S7D–F). In the presence of 50 nM and 123 nM CTCF, 43,648 and 48,065 Smc3 peaks could be identified by ChIP-seq, respectively, compared with 9841 in the absence of recombinant CTCF (Supplemental Table S5). Most of these newly appearing cohesin peaks (88%) overlapped with CTCF peaks in pronuclei, and many but not all (52%) overlapped with CTCF peaks in XL-177 cells (Fig. 4D). Accordingly, the distribution of genomic distances between Smc3 sites in Xenopus pronuclei assembled in the presence of human CTCF resembled the corresponding distribution of Smc3 sites in XL-177 cells and MEFs, whereas this was not the case when pronuclei were assembled without exogenously added CTCF (Fig. 4F). Furthermore, de novo motif analysis of the Smc3 binding sites in pronuclei revealed consensus motifs for CTCF and CTCFL (Supplemental Table S6). In contrast, de novo motif analysis of the 9841 Smc3 ChIP-seq peaks detected in the absence of CTCF did not identify CTCF and CTCFL consensus motifs. Instead, many of these sites were located within ±2.5 kb of transcription start sites (17.4%) or within 10 kb behind transcription termination sites (25.4%). Addition of human CTCF did not increase the levels of cohesin on chromatin (Supplemental Fig. S7A,B), suggesting that CTCF altered the position of cohesin on chromatin and not its levels, as is the case in mammalian cells (Busslinger et al. 2017). These results indicate that in Xenopus pronuclei, cohesin does normally not accumulate at CTCF sites because most of these are not bound by CTCF unless CTCF is exogenously added.
In Xenopus pronuclei, cohesin extrudes short chromatin loops
To test whether the addition of CTCF enables the formation of TADs, we assembled pronuclei for 140 min in Xenopus egg extracts supplemented with or without 50 nM human CTCF and analyzed chromatin interactions by Hi-C. However, even upon addition of CTCF, no TADs or corner peaks could be detected by visual inspection, genome-wide TAD and corner peak calling, and by aggregate peak analysis, using TAD and corner peak coordinates from XL-177 cells (Fig. 3A–C; Supplemental Fig. S5B–H; Supplemental Table S2). Weak compartmental signals similar to those in XL-177 cells could be detected in pronuclei assembled in either the presence or absence of CTCF (Fig. 3D–G), suggesting that CTCF does not affect compartmentalization, as reported for mammalian cells (Nora et al. 2017; Wutz et al. 2017).
We therefore analyzed whether any long-range chromosomal cis interactions are formed in the presence of CTCF independently of whether these interactions overlap with the coordinates of TADs and corner peaks in XL-177 cells. For this purpose, we computed all consecutive pairs of directly adjacent Smc3 binding sites with different genomic distances, based on Smc3 peak calling in our ChIP-seq data sets. These pairs, generated newly and unbiased within each biological condition, were then used as loop anchor coordinates for genome-wide analysis of the corresponding Hi-C data. As a positive control, we used Hi-C data from XL-177 cells. In these, aggregate peak analyses clearly detected cis interactions between consecutive Smc3 binding sites over genomic distances of 25–100 kb, 100–200 kb, and 200–300 kb (Fig. 5A). In contrast, in Xenopus pronuclei assembled in the presence of CTCF, we could not detect any cis interactions between Smc3 binding sites in the size ranges of 100–200 kb and 200–300 kb. However, this analysis did reveal a weak Hi-C signal over short distances (25–100 kb) (Fig. 5A).
Figure 5.

Addition of recombinant CTCF to Xenopus pronuclei fails to induce typical corner peak or TAD formation but generates weak contacts between Smc3 sites at very small distances. (A) Log2 of observed/control of aggregate contact frequencies between consecutive, directly adjacent Smc3 binding sites with a distance between the binding sites as indicated and 5-kb bin size, for demembranated frog sperm in Xenopus egg extract after 140 min (pronuclei 140′), pronuclei 140′ with addition of 50 nM CTCF protein, and frog XL-177 cells. To calculate control values, Smc3 binding sites were shifted by 10 Mb. (B) Log2 of observed/control of aggregate contact frequencies for mouse WT MEF cells and Smc3 KO MEF cells between consecutive, directly adjacent Smc3 binding sites in WT MEF cells with a distance between the binding sites of 25–100 kb and 5-kb bin size. Hi-C data by Banigan et al. (2023); ChIP-seq data from this study. To calculate control values, Smc3 binding sites were shifted by 10 Mb. (C) Average profiles of the directionality index for XL-177 cells, pronuclei 140′, and pronuclei 140′ with addition of 50 nM CTCF protein over unambiguously oriented CTCF binding sites detected in pronuclei 140′ +CTCF.
Because previous studies focused on cohesin loops in the 100- to 300-kb range (Rao et al. 2017; Wutz et al. 2017), we tested whether such short-range interactions also depend on cohesin. For this purpose, we compared Hi-C interactions in wild-type MEFs with those of Smc3-depleted MEFs (Banigan et al. 2023). Aggregate peak analyses detected 25- to 100-kb cis interactions between cohesin binding sites in wild-type MEFs but not in Smc3-depleted cells (Fig. 5B), indicating that these short-range interactions depend on cohesin, as do many longer loops. The Hi-C signal that we detected in Xenopus pronuclei >25–100 kb could therefore represent cis interactions generated by cohesin.
If these short chromatin loops had been formed by cohesin-mediated DNA loop extrusion, one would predict that these cis interactions are flanked by CTCF sites in a convergent orientation (Rao et al. 2014; de Wit et al. 2015; Vietri Rudan et al. 2015). To test this possibility, we analyzed whether a CTCF directionality bias can be detected in the genomic cis interactions that we observed in Xenopus pronuclei in the presence of CTCF. For this purpose, we identified 36,001 CTCF ChIP-seq peaks in Xenopus pronuclei assembled in the presence of CTCF, which overlapped with one or more CTCF motifs only on the DNA plus strand and 35,933 peaks, which overlapped with CTCF motifs only on the minus strand. When we used the genomic coordinates of these sites to determine the directionality bias of cis interactions in XL-177 cells, we observed a strong directionality bias (Fig. 5C). In contrast, in pronuclei assembled in Xenopus egg extracts in the absence of CTCF, only a weak directionality bias could be detected. This supports our findings, which suggest that only little CTCF is bound to chromosomes in Xenopus pronuclei. However, in Xenopus pronuclei assembled in the presence of CTCF, a clear directionality bias was observed, similar to the one observed in XL-177 cells (Fig. 5C). This indicates that the sparse 25- to 100-kb cis interactions that are formed in these pronuclei are predominantly anchored at the 3′-end of CTCF motifs, that is, at the N-terminal side of CTCF. These results support the view that cohesin arrives at CTCF sites via loop extrusion.
Discussion
Is the absence of TADs a general feature of vertebrate sperm?
Transport and delivery of the male genome to the egg is the key function of sperm cells. Despite the fundamental importance of this function for the beginning of organismal life, it is poorly understood how the male genome is “packaged” in sperm and “unpackaged” after fertilization. Furthermore, previous studies have come to different conclusions for how the sperm genome is organized in different vertebrate species, reporting the presence of TADs in rhesus monkeys and in most mouse studies (Battulin et al. 2015; Du et al. 2017; Jung et al. 2017, 2019; Ke et al. 2017; Wang et al. 2019; Luo et al. 2020) but not in one analysis of human sperm (Chen et al. 2019). We have therefore analyzed the sperm genome organization in X. laevis and reanalyzed sperm in humans and mice. Our data indicate that X. laevis and human sperm chromosomes are not organized in TADs. During the preparation of our paper, similar results were reported for X. tropicalis sperm (Shi et al. 2023). These cells also lack TADs but contain a small number (144) of exceptionally long DNA loops (median length, 5.1 Mb). Such “supersized loops” cannot be detected in X. laevis sperm, indicating that these structures occur only in X. tropicalis.
Our experiments confirmed that TADs can be detected in samples of mouse sperm, as reported, and suggest that differences in the sperm isolation procedures used cannot account for these differences. However, recent work from Yin et al. (2023) showed that such samples can be contaminated by chromatin from somatic cells, which cannot be detected by DIC microscopy, and that the presence of TADs can be attributed to these contaminations. This finding raises the possibility that TADs detected in sperm from other species might originate from somatic chromatin contaminations, which could explain why species as closely related as monkeys and humans were found to differ in their sperm genome architecture. It is therefore conceivable that the absence of TADs is a general feature of vertebrate sperm, perhaps because CTCF levels are down-regulated during spermiogenesis (Nagano et al. 2022) and/or because cohesin complexes are unable to extrude DNA, which is tightly bound by protamines. However, more experimental work will be required to test this hypothesis.
How is the sperm genome folded in the absence of TADs?
Our Hi-C analysis of human and frog sperm revealed cis interactions over distances that are similar in length to those in mitotic cells, namely, much longer than those typically observed in interphase cells (Fig. 6A,B). It is unclear whether these interactions are formed by cohesin or condensin complexes. Instead, they could directly or indirectly be caused by the compaction of DNA by protamines. In theory, these long-range cis interactions could also reflect the presence of residual compartments in sperm chromatin. However, our observation that chromatinization of sperm DNA in Xenopus egg extracts increases compartmentalization but decreases these long-range interactions argues against the later interpretation and instead is consistent with the possibility that protamines have some role in the formation of these interactions. Additional work will be required to understand how sperm DNA is folded.
Figure 6.
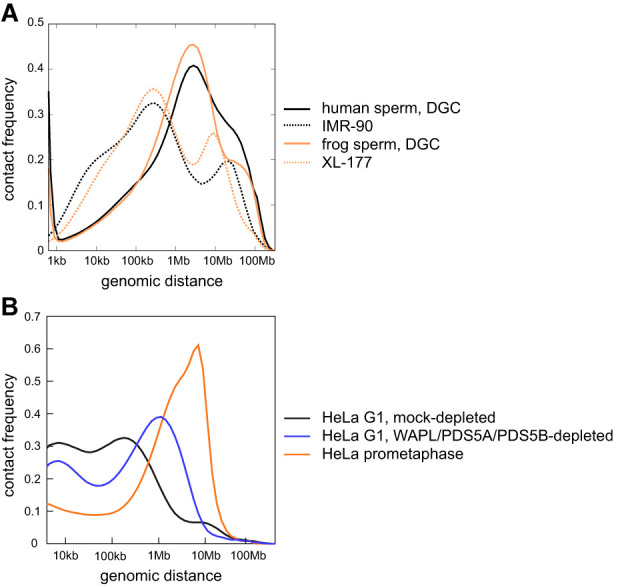
The genome organization of human and frog sperm differs from that of somatic cells. (A) Contact frequency as a function of genomic distance for human sperm enriched by DGC, human IMR-90 cells by Rao et al. (2014), frog sperm enriched by DGC, and frog XL-177 cells. (B) Contact frequency as a function of genomic distance for human HeLa cells in G1 that were mock-depleted or joint-WAPL/PDS5A/PDS5B-depleted and for HeLa cells in prometaphase, all from Wutz et al. (2017).
What limits the formation of TADs in Xenopus pronuclei?
Even though we observed a major reduction in the length of chromosomal cis interactions upon incubation of demembranated sperm in Xenopus egg extracts, no TADs were assembled in the resulting pronuclei. We cannot exclude the possibility that the absence of TADs reflects a technical limitation of our in vitro reconstitution system. However, we suspect that this is not the case and that the Xenopus egg extract system instead faithfully recapitulates the in vivo situation because compartmentalization increased in these pronuclei and because TADs are also only formed after ZGA at the MBT in the related frog X. tropicalis (Niu et al. 2021).
Our results indicate that at least two requirements that are needed for the formation of TADs are missing or limiting in Xenopus pronuclei. First, in these pronuclei most CTCF sites appear not to be bound by CTCF so that these sites would not be able to establish TAD boundaries by blocking cohesin-mediated loop extrusion. We do not know whether CTCF sites are unoccupied because CTCF cannot bind to these, for example, because DNA methylation prevents CTCF binding (Bell and Felsenfeld 2000) or because CTCF levels are limiting. However, our finding that human CTCF can bind to CTCF sites in Xenopus pronuclei argues in support of the latter possibility. This interpretation is consistent with the observation that CTCF is down-regulated during spermiogenesis in mice (Nagano et al. 2022), cannot be detected in human sperm (Chen et al. 2019), and is up-regulated during ZGA in X. tropicalis (Niu et al. 2021).
Second, in Xenopus pronuclei assembled in the presence of CTCF, cohesin only forms sparse and short cis interactions in the range of 25–100 kb, similar to the average length of cohesin loops that has been observed in mouse zygotes (65 kb) (Gassler et al. 2017). The finding that cohesin loops are barely detectable in pronuclei assembled in Xenopus egg extracts is surprising because similar extracts have been used to reconstitute cohesin-mediated DNA loop extrusion (Golfier et al. 2020). However, loop extrusion could only be reconstituted in these extracts when histones were depleted. This requirement has been attributed to the phenomenon that chromatinization of DNA by histones shortens DNA and thus creates tension if these DNA molecules are tethered at their ends to a glass surface, as is the case in loop extrusion assays (Golfier et al. 2020). This tension can then block loop extrusion if the tension exceeds the stalling force of cohesin (Davidson et al. 2023). However, it is also conceivable that cohesin-mediated loop extrusion is initiated less frequently on chromatinized DNA and that we observed only few and short chromatin loops in Xenopus pronuclei for this reason. For example, it is possible that the generation of accessible DNA regions during ZGA facilitates cohesin loading, as has recently been proposed for zebrafish embryos (Galitsyna et al. 2023) and that cohesin can therefore only fully assemble TADs during ZGA.
In summary, our results suggest that the mechanisms that generate long-range cis interactions in Xenopus and human sperm differ from those in somatic cells and in oocytes, in which chromatin loops are formed by cohesin. We suspect that sperm cells are unique in this respect because their DNA is tightly packaged by protamines, which might generate chromatin structures that cannot be extruded. Our findings further indicate that following fertilization, TADs can only be assembled in Xenopus embryos during ZGA because before this stage many CTCF sites are not occupied by CTCF, and cohesin can only form short-range chromatin loops.
Methods
Isolation of sperm cells
Frog sperm was isolated from X. laevis males obtained from Nasco. For sequencing experiments, sperm was isolated from J strain males.
Demembranated frog sperm was prepared using density gradient centrifugation as previously described (Lebofsky et al. 2009). To prepare membranated sperm when the demembranation step is skipped, no Triton X-100 was added at step 29 of the protocol.
Human ejaculate was obtained from anonymized male donors in accordance with a study protocol approved by the ethics committee of the Medical University of Vienna (ECS 1487/2018). Spermatozoa isolation from ejaculate using discontinuous density gradient centrifugation was performed as previously described (World Health Organization 2010). Percoll plus (Sigma-Aldrich E0414) was used to prepare the isotonic density gradient medium. The main centrifugation at step 3 of the protocol was performed at 400g for 30 min at room temperature; centrifugations for the subsequent washing steps (5, 6), at 200g for 10 min.
To isolate human sperm using the swim-up assay, a similar procedure as for mouse swim-up sperm (see below) was performed. In multiple tubes, 0.3 mL of fresh ejaculate was overlayed with 0.5 mL sperm motility medium as described below for mouse sperm and then incubated for 45 min at 37°C, 5% CO2. Subsequently, 0.4 mL sample per tube was harvested from the top, pooled, and transferred to a 12-well plate with sperm motility medium, after which, further swim-up incubations were performed as for mouse sperm.
To obtain mouse sperm by swim-up, cauda epididymides were isolated from 8- to 10-wk-old male C57BL/6J mice. All animals were kept in accordance with local laws and regulations. The cauda epididymides were rinsed in PBS and transferred to sperm motility medium (135 mM NaCl, 5 mM KCl, 1 mM MgSO4, 2 mM CaCl2, 30 mM HEPES at pH 7.4, 10 mM lactic acid, 1 mM sodium pyruvate, 20 mg/mL BSA, 25 mM NaHCO3) in a 12-well plate, where they were cut, and mature spermatozoa were allowed to swim into the medium for 30–45 min at 37°C, 5% CO2. Subsequently, the supernatant was transferred to a new well and again incubated for 30–45 min at 37°C, 5% CO2. The above step was repeated three times. Finally, spermatozoa were spun down at 300g for 5 min.
For imaging of sperm samples, independent of species, a 1.5-µL sample was mixed with 1.5 µL H2O containing 20 µg/mL Hoechst 33258 and 20 µg/mL Nile Red (Santa Cruz sc-203747) and analyzed on Zeiss LSM780 or LSM880 confocal microscopes. For imaging to determine isolation purity, DIC microscopy was performed on a Zeiss Axio imager.Z2 equipped with a Hamamatsu Orca flash 4 camera.
For Hi-C experiments, independent of species, sperm cells were cross-linked with 1% formaldehyde for 10 min at room temperature and further processed according to the in situ Hi-C protocol (Rao et al. 2014) as described under Hi-C library preparation below.
Preparation of X. laevis egg extract and assembly of pronuclei
Unactivated low-speed supernatant (ULSS) was prepared as previously described (Gillespie et al. 2012). To assemble pronuclei, ULSS was first activated by adding 0.3 mM CaCl2, 1:40 energy regenerator mix (1 M phosphocreatine K salt, 600 µg/mL creatine phosphokinase in 10 mM HEPES–KOH at pH 7.6), and 250 µg/mL cycloheximide. The extract was subsequently incubated for 20 min at room temperature, after which demembranated X. laevis sperm was added at a concentration of 2500 nuclei per microliter extract. The samples were then again incubated at room temperature. After a specified amount of time, the extract containing assembled pronuclei was used for subsequent experiments such as chromatin isolation, ChIP-seq, or Hi-C. Successful assembly of pronuclei was verified by mixing a 1.5-µL sample with 1.5 µL H2O containing 20 µg/mL Hoechst 33258 and 20 µg/mL Nile Red (Santa Cruz sc-203747), followed by imaging on Zeiss LSM780 or LSM880 confocal microscopes.
For pronuclei experiments with addition of CTCF, functional human HaloTag-TMRCTCF protein, as previously described and characterized in detail (Davidson et al. 2016), was added to the extract at the desired concentration (50 nM for Hi-C experiments or 50 nM or 123 nM for ChIP-seq experiments) during the incubation with CaCl2, energy regenerator mix, and cycloheximide.
Hi-C library preparation
Hi-C for all samples and species was performed using the in situ Hi-C protocol as previously described (Rao et al. 2014). For details on cell and nuclei numbers, see the Supplemental Methods.
For Xenopus demembranated and membranated sperm samples, as well as Xenopus XL-177 samples, libraries were prepared according to the in situ Hi-C protocol.
For human sperm samples, libraries were prepared according to the in situ Hi-C protocol, with the first two centrifugation steps of the protocol being performed for 10 min. At step 5, some of the cells were set aside for determination of purity and cell count. The purity of the spermatozoa was determined by DIC microscopy using a Zeiss Axio imager.Z2 equipped with a Hamamatsu Orca flash 4 camera. To count cells, a hemocytometer was used.
For mouse sperm, cross-linking was performed with 1% formaldehyde for 10 min at room temperature. Hi-C libraries were prepared according to the in situ Hi-C protocol. At step 5 of the protocol, some of the cells were set aside for determination of purity and cell count as described above for human sperm.
For Xenopus pronuclei samples, egg extract was mixed with demembranated sperm nuclei. Following incubation of sperm in egg extract to assemble pronuclei, 16% formaldehyde (Thermo Fisher Scientific 28908) was added to a final concentration of 1%, and the samples were incubated for 10 min at room temperature. Next, the formaldehyde was quenched by adding glycine to a final concentration of 0.2 M and incubating for 5 min at room temperature. Assembled pronuclei were enriched by centrifuging for 5 min at 1500g at 4°C, which resulted in a cloudy, white top phase containing pronuclei. The pronuclei were now transferred to a new tube and diluted with Hi-C lysis buffer, from which point onward the in situ Hi-C protocol was followed starting at step 8. Centrifugations at steps 8 and 9 were performed at 1500g for 5 min at 4°C.
For XL-177 nuclei cross-linked in Xenopus egg extract or buffer, libraries were prepared according to the in situ Hi-C protocol.
Sequencing of all libraries was performed on Illumina HiSeq 2500 or NovaSeq 6000 instruments by the Next Generation Sequencing Facility at Vienna BioCenter Core Facilities (VBCF), member of the Vienna BioCenter (VBC), Austria.
For details on Hi-C data processing and analysis, see the Supplemental Methods.
ChIP followed by high-throughput sequencing (ChIP-seq)
For ChIP-seq of XL-177 cells, sample preparation and ChIP was performed as previously described (Wendt et al. 2008). The following antibody was used: anti-Smc3 (Bethyl A300-060A).
For ChIP-seq of Xenopus pronuclei, pronuclei with or without CTCF addition were prepared as described above. For each ChIP-seq sample, 1 mL of Xenopus egg extract was mixed and incubated with 2.5 million demembranated sperm nuclei. For calibrated ChIP-seq samples, 75,000 human HeLa Kyoto cells were spiked-in after generation of pronuclei and just before cross-linking. Cross-linking of samples occurred in 1% formaldehyde (Thermo Fisher Scientific 28908) for 10 min at room temperature on a rotator. Subsequently, glycine was added to a final concentration of 0.2 M, followed by an incubation at room temperature for 5 min on a rotator. Samples were then centrifuged for 5 min at 1500g at 4°C, and the cloudy, white top phase containing pronuclei and the pellet were recovered and mixed. Following an identical second centrifugation and recovery of the top phase and pellet, the samples were mixed again and used for ChIP. ChIP was performed as previously described (Wendt et al. 2008), and the following antibodies were used: anti-Smc3 (Bethyl A300-060A) and anti-CTCF (Millipore 07-729).
For ChIP-seq of mouse MEF cells, sample preparation and ChIP was performed as previously described (Busslinger et al. 2017). The following antibody was used: anti-Smc3 (Bethyl A300-060A).
For all samples, the DNA samples were submitted for library preparation and Illumina sequencing on HiSeq 2500 SR50 to the Next Generation Sequencing Facility at VBCF, member of the VBC.
For details on ChIP-seq data processing and analysis, see the Supplemental Methods.
CTCF directionality analysis
To analyze CTCF directionality in Xenopus samples, we identified CTCF ChIP-seq peaks that overlap with one or more CTCF motifs only on one DNA strand and determined the directionality bias of genomic cis interactions.
The X. laevis genome assembly 9.2 was scanned for the generic CTCF binding site consensus model in HomerMotifDB (Motif 50) with scanMotifGenomeWide.pl as implemented in HOMER v4.11 (Heinz et al. 2010). The directionality index tracks were generated with findTADsAndLoops.pl in HOMER v4.11 by calculating for each considered bin the difference of contact partners downstream from this bin versus upstream under the assumption that at the point of maximum switch in direction, downstream and upstream numbers are the same, using an approach described previously (Dixon et al. 2012). Average aggregations of plots were generated with the sitepro tool of the CEAS software suite (Shin et al. 2009).
Data access
All raw and processed sequencing data generated in this study have been submitted to the NCBI Gene Expression Omnibus (GEO; https://www.ncbi.nlm.nih.gov/geo/) under accession number GSE237051.
Supplementary Material
Acknowledgments
We thank O. Rando for communicating results before publication, M. Zaczek for providing human CTCF, and the Next Generation Sequencing Facility at Vienna BioCenter Core Facilities (VBCF) for excellent technical support. Research in the laboratory of J.-M.P. was supported by Boehringer Ingelheim, the Austrian Research Promotion Agency (headquarter grant FFG-FO999902549), the European Research Council under the European Union's Horizon 2020 research and innovation program GA no. 101020558, the Human Frontier Science Program (grant RGP0057/2018), and the Vienna Science and Technology Fund (grant LS19-029). J.-M.P. is also an adjunct professor at the Medical University of Vienna.
Author contributions: G.J. and W.T. designed, performed, and analyzed experiments; C.V. and R.R.S. performed bioinformatic analyses; G.S. obtained and provided human sperm samples; J.-M.P. conceived and supervised research; and G.J. and J.-M.P. wrote the manuscript, with input from all authors.
Footnotes
[Supplemental material is available for this article.]
Article published online before print. Article, supplemental material, and publication date are at https://www.genome.org/cgi/doi/10.1101/gr.277865.123.
Competing interest statement
The authors declare no competing interests.
References
- Abramo K, Valton A-L, Venev SV, Ozadam H, Fox AN, Dekker J. 2019. A chromosome folding intermediate at the condensin-to-cohesin transition during telophase. Nat Cell Biol 21: 1393–1402. 10.1038/s41556-019-0406-2 [DOI] [PMC free article] [PubMed] [Google Scholar]
- Balhorn R. 2007. The protamine family of sperm nuclear proteins. Genome Biol 8: 227. 10.1186/gb-2007-8-9-227 [DOI] [PMC free article] [PubMed] [Google Scholar]
- Banigan EJ, Tang W, van den Berg AA, Stocsits RR, Wutz G, Brandão HB, Busslinger GA, Peters J-M, Mirny LA. 2023. Transcription shapes 3D chromatin organization by interacting with loop extrusion. Proc Natl Acad Sci 120: e2210480120. 10.1073/pnas.2210480120 [DOI] [PMC free article] [PubMed] [Google Scholar]
- Battulin N, Fishman VS, Mazur AM, Pomaznoy M, Khabarova AA, Afonnikov DA, Prokhortchouk EB, Serov OL. 2015. Comparison of the three-dimensional organization of sperm and fibroblast genomes using the Hi-C approach. Genome Biol 16: 77. 10.1186/s13059-015-0642-0 [DOI] [PMC free article] [PubMed] [Google Scholar]
- Beckwith KS, Ødegård-Fougner Ø, Morero NR, Barton C, Schueder F, Tang W, Alexander S, Peters J-M, Jungmann R, Birney E, et al. 2021. Nanoscale 3D DNA tracing in single human cells visualizes loop extrusion directly in situ. bioRxiv 10.1101/2021.04.12.439407 [DOI]
- Bell AC, Felsenfeld G. 2000. Methylation of a CTCF-dependent boundary controls imprinted expression of the Igf2 gene. Nature 405: 482–485. 10.1038/35013100 [DOI] [PubMed] [Google Scholar]
- Busslinger GA, Stocsits RR, van der Lelij P, Axelsson E, Tedeschi A, Galjart N, Peters J-M. 2017. Cohesin is positioned in mammalian genomes by transcription, CTCF and Wapl. Nature 544: 503–507. 10.1038/nature22063 [DOI] [PMC free article] [PubMed] [Google Scholar]
- Cai Y, Hossain MJ, Hériché J-K, Politi AZ, Walther N, Koch B, Wachsmuth M, Nijmeijer B, Kueblbeck M, Martinic-Kavur M, et al. 2018. Experimental and computational framework for a dynamic protein atlas of human cell division. Nature 561: 411–415. 10.1038/s41586-018-0518-z [DOI] [PMC free article] [PubMed] [Google Scholar]
- Cattoglio C, Pustova I, Walther N, Ho JJ, Hantsche-Grininger M, Inouye CJ, Hossain MJ, Dailey GM, Ellenberg J, Darzacq X, et al. 2019. Determining cellular CTCF and cohesin abundances to constrain 3D genome models. eLife 8: e40164. 10.7554/eLife.40164 [DOI] [PMC free article] [PubMed] [Google Scholar]
- Chen X, Ke Y, Wu K, Zhao H, Sun Y, Gao L, Liu Z, Zhang J, Tao W, Hou Z, et al. 2019. Key role for CTCF in establishing chromatin structure in human embryos. Nature 576: 306–310. 10.1038/s41586-019-1812-0 [DOI] [PubMed] [Google Scholar]
- Dasso M, Newport JW. 1990. Completion of DNA replication is monitored by a feedback system that controls the initiation of mitosis in vitro: studies in Xenopus. Cell 61: 811–823. 10.1016/0092-8674(90)90191-G [DOI] [PubMed] [Google Scholar]
- Davidson IF, Peters J-M. 2021. Genome folding through loop extrusion by SMC complexes. Nat Rev Mol Cell Biol 22: 445–464. 10.1038/s41580-021-00349-7 [DOI] [PubMed] [Google Scholar]
- Davidson IF, Goetz D, Zaczek MP, Molodtsov MI, Huis In ‘t Veld PJ, Weissmann F, Litos G, Cisneros DA, Ocampo-Hafalla M, Ladurner R, et al. 2016. Rapid movement and transcriptional re-localization of human cohesin on DNA. EMBO J 35: 2671–2685. 10.15252/embj.201695402 [DOI] [PMC free article] [PubMed] [Google Scholar]
- Davidson IF, Bauer B, Goetz D, Tang W, Wutz G, Peters J-M. 2019. DNA loop extrusion by human cohesin. Science 366: 1338–1345. 10.1126/science.aaz3418 [DOI] [PubMed] [Google Scholar]
- Davidson IF, Barth R, Zaczek M, van der Torre J, Tang W, Nagasaka K, Janissen R, Kerssemakers J, Wutz G, Dekker C, et al. 2023. CTCF is a DNA-tension-dependent barrier to cohesin-mediated loop extrusion. Nature 616: 822–827. 10.1038/s41586-023-05961-5 [DOI] [PMC free article] [PubMed] [Google Scholar]
- Deneke VE, Pauli A. 2021. The fertilization enigma: how sperm and egg fuse. Annu Rev Cell Dev Biol 37: 391–414. 10.1146/annurev-cellbio-120219-021751 [DOI] [PubMed] [Google Scholar]
- de Wit E, Vos ESM, Holwerda SJB, Valdes-Quezada C, Verstegen MJAM, Teunissen H, Splinter E, Wijchers PJ, Krijger PHL, de Laat W. 2015. CTCF binding polarity determines chromatin looping. Mol Cell 60: 676–684. 10.1016/j.molcel.2015.09.023 [DOI] [PubMed] [Google Scholar]
- Dixon JR, Selvaraj S, Yue F, Kim A, Li Y, Shen Y, Hu M, Liu JS, Ren B. 2012. Topological domains in mammalian genomes identified by analysis of chromatin interactions. Nature 485: 376–380. 10.1038/nature11082 [DOI] [PMC free article] [PubMed] [Google Scholar]
- Du Z, Zheng H, Huang B, Ma R, Wu J, Zhang X, He J, Xiang Y, Wang Q, Li Y, et al. 2017. Allelic reprogramming of 3D chromatin architecture during early mammalian development. Nature 547: 232–235. 10.1038/nature23263 [DOI] [PubMed] [Google Scholar]
- Durand NC, Shamim MS, Machol I, Rao SSP, Huntley MH, Lander ES, Aiden EL. 2016. Juicer provides a one-click system for analyzing loop-resolution Hi-C experiments. Cell Syst 3: 95–98. 10.1016/j.cels.2016.07.002 [DOI] [PMC free article] [PubMed] [Google Scholar]
- Fischle W, Tseng BS, Dormann HL, Ueberheide BM, Garcia BA, Shabanowitz J, Hunt DF, Funabiki H, Allis CD. 2005. Regulation of HP1-chromatin binding by histone H3 methylation and phosphorylation. Nature 438: 1116–1122. 10.1038/nature04219 [DOI] [PubMed] [Google Scholar]
- Flyamer IM, Gassler J, Imakaev M, Brandão HB, Ulianov SV, Abdennur N, Razin SV, Mirny LA, Tachibana-Konwalski K. 2017. Single-nucleus Hi-C reveals unique chromatin reorganization at oocyte-to-zygote transition. Nature 544: 110–114. 10.1038/nature21711 [DOI] [PMC free article] [PubMed] [Google Scholar]
- Fudenberg G, Imakaev M, Lu C, Goloborodko A, Abdennur N, Mirny LA. 2016. Formation of chromosomal domains by loop extrusion. Cell Rep 15: 2038–2049. 10.1016/j.celrep.2016.04.085 [DOI] [PMC free article] [PubMed] [Google Scholar]
- Gabriele M, Brandão HB, Grosse-Holz S, Jha A, Dailey GM, Cattoglio C, Hsieh T-HS, Mirny L, Zechner C, Hansen AS. 2022. Dynamics of CTCF- and cohesin-mediated chromatin looping revealed by live-cell imaging. Science 376: 496–501. 10.1126/science.abn6583 [DOI] [PMC free article] [PubMed] [Google Scholar]
- Galitsyna A, Ulianov SV, Bykov NS, Veil M, Gao M, Perevoschikova K, Gelfand M, Razin SV, Mirny L, Onichtchouk D. 2023. Extrusion fountains are hallmarks of chromosome organization emerging upon zygotic genome activation. bioRxiv 10.1101/2023.07.15.549120 [DOI]
- Gassler J, Brandão HB, Imakaev M, Flyamer IM, Ladstätter S, Bickmore WA, Peters J-M, Mirny LA, Tachibana K. 2017. A mechanism of cohesin-dependent loop extrusion organizes zygotic genome architecture. EMBO J 36: 3600–3618. 10.15252/embj.201798083 [DOI] [PMC free article] [PubMed] [Google Scholar]
- Gerlich D, Koch B, Dupeux F, Peters JM, Ellenberg J. 2006. Live-cell imaging reveals a stable cohesin-chromatin interaction after but not before DNA replication. Curr Biol 16: 1571–1578. 10.1016/j.cub.2006.06.068 [DOI] [PubMed] [Google Scholar]
- Gibcus JH, Samejima K, Goloborodko A, Samejima I, Naumova N, Nuebler J, Kanemaki MT, Xie L, Paulson JR, Earnshaw WC, et al. 2018. A pathway for mitotic chromosome formation. Science 359: eaao6135-14. 10.1126/science.aao6135 [DOI] [PMC free article] [PubMed] [Google Scholar]
- Gillespie PJ, Gambus A, Blow JJ. 2012. Preparation and use of Xenopus egg extracts to study DNA replication and chromatin associated proteins. Methods 57: 203–213. 10.1016/j.ymeth.2012.03.029 [DOI] [PMC free article] [PubMed] [Google Scholar]
- Golfier S, Quail T, Kimura H, Brugués J. 2020. Cohesin and condensin extrude DNA loops in a cell cycle-dependent manner. eLife 9: 11202–11216. 10.7554/eLife.53885 [DOI] [PMC free article] [PubMed] [Google Scholar]
- Heinz S, Benner C, Spann N, Bertolino E, Lin YC, Laslo P, Cheng JX, Murre C, Singh H, Glass CK. 2010. Simple combinations of lineage-determining transcription factors prime cis-regulatory elements required for macrophage and B cell identities. Mol Cell 38: 576–589. 10.1016/j.molcel.2010.05.004 [DOI] [PMC free article] [PubMed] [Google Scholar]
- Hirota T, Gerlich D, Koch B, Ellenberg J, Peters J-M. 2004. Distinct functions of condensin I and II in mitotic chromosome assembly. J Cell Sci 117: 6435–6445. 10.1242/jcs.01604 [DOI] [PubMed] [Google Scholar]
- Hud NV, Allen MJ, Downing KH, Lee J, Balhorn R. 1993. Identification of the elemental packing unit of DNA in mammalian sperm cells by atomic force microscopy. Biochem Biophys Res Commun 193: 1347–1354. 10.1006/bbrc.1993.1773 [DOI] [PubMed] [Google Scholar]
- Jung YH, Sauria MEG, Lyu X, Cheema MS, Ausio J, Taylor J, Corces VG. 2017. Chromatin states in mouse sperm correlate with embryonic and adult regulatory landscapes. Cell Rep 18: 1366–1382. 10.1016/j.celrep.2017.01.034 [DOI] [PMC free article] [PubMed] [Google Scholar]
- Jung YH, Kremsky I, Gold HB, Rowley MJ, Punyawai K, Buonanotte A, Lyu X, Bixler BJ, Chan AWS, Corces VG. 2019. Maintenance of CTCF- and transcription factor- mediated interactions from the gametes to the early mouse embryo. Mol Cell 75: 154–171.e25. 10.1016/j.molcel.2019.04.014 [DOI] [PMC free article] [PubMed] [Google Scholar]
- Ke Y, Xu Y, Chen X, Feng S, Liu Z, Sun Y, Yao X, Li F, Zhu W, Gao L, et al. 2017. 3D chromatin structures of mature gametes and structural reprogramming during mammalian embryogenesis. Cell 170: 367–381.e20. 10.1016/j.cell.2017.06.029 [DOI] [PubMed] [Google Scholar]
- Kim Y, Shi Z, Zhang H, Finkelstein IJ, Yu H. 2019. Human cohesin compacts DNA by loop extrusion. Science 47: 1345–1349. 10.1126/science.aaz4475 [DOI] [PMC free article] [PubMed] [Google Scholar]
- Kornberg RD. 1974. Chromatin structure: a repeating unit of histones and DNA. Science 184: 868–871. 10.1126/science.184.4139.868 [DOI] [PubMed] [Google Scholar]
- Le Blévec E, Muroňová J, Ray PF, Arnoult C. 2020. Paternal epigenetics: mammalian sperm provide much more than DNA at fertilization. Mol Cell Endocrinol 518: 110964. 10.1016/j.mce.2020.110964 [DOI] [PubMed] [Google Scholar]
- Lebofsky R, Takahashi T, Walter JC. 2009. DNA replication in nucleus-free Xenopus egg extracts. Methods Mol Biol 521: 229–252. 10.1007/978-1-60327-815-7_13 [DOI] [PubMed] [Google Scholar]
- Li D, He M, Tang Q, Tian S, Zhang J, Li Y, Wang D, Jin L, Ning C, Zhu W, et al. 2022. Comparative 3D genome architecture in vertebrates. BMC Biol 20: 99. 10.1186/s12915-022-01301-7 [DOI] [PMC free article] [PubMed] [Google Scholar]
- Lieberman-Aiden E, van Berkum NL, Williams L, Imakaev M, Ragoczy T, Telling A, Amit I, Lajoie BR, Sabo PJ, Dorschner MO, et al. 2009. Comprehensive mapping of long-range interactions reveals folding principles of the human genome. Science 326: 289–293. 10.1126/science.1181369 [DOI] [PMC free article] [PubMed] [Google Scholar]
- Luo Z, Wang X, Jiang H, Wang R, Chen J, Chen Y, Xu Q, Cao J, Gong X, Wu J, et al. 2020. Reorganized 3D genome structures support transcriptional regulation in mouse spermatogenesis. iScience 23: 101034. 10.1016/j.isci.2020.101034 [DOI] [PMC free article] [PubMed] [Google Scholar]
- Murray AW. 1991. Cell cycle extracts. Methods Cell Biol 36: 581–605. 10.1016/S0091-679X(08)60298-8 [DOI] [PubMed] [Google Scholar]
- Nagano T, Lubling Y, Várnai C, Dudley C, Leung W, Baran Y, Cohen NM, Wingett S, Fraser P, Tanay A. 2017. Cell-cycle dynamics of chromosomal organization at single-cell resolution. Nature 547: 61–67. 10.1038/nature23001 [DOI] [PMC free article] [PubMed] [Google Scholar]
- Nagano M, Hu B, Yokobayashi S, Yamamura A, Umemura F, Coradin M, Ohta H, Yabuta Y, Ishikura Y, Okamoto I, et al. 2022. Nucleome programming is required for the foundation of totipotency in mammalian germline development. EMBO J 41: e110600. 10.15252/embj.2022110600 [DOI] [PMC free article] [PubMed] [Google Scholar]
- Naumova N, Imakaev M, Fudenberg G, Zhan Y, Lajoie BR, Mirny LA, Dekker J. 2013. Organization of the mitotic chromosome. Science 342: 948–953. 10.1126/science.1236083 [DOI] [PMC free article] [PubMed] [Google Scholar]
- Nichols MH, Corces VG. 2015. A CTCF code for 3D genome architecture. Cell 162: 703–705. 10.1016/j.cell.2015.07.053 [DOI] [PMC free article] [PubMed] [Google Scholar]
- Niu L, Shen W, Shi Z, Tan Y, He N, Wan J, Sun J, Zhang Y, Huang Y, Wang W, et al. 2021. Three-dimensional folding dynamics of the Xenopus tropicalis genome. Nat Genet 53: 1075–1087. 10.1038/s41588-021-00878-z [DOI] [PMC free article] [PubMed] [Google Scholar]
- Nora EP, Lajoie BR, Schulz EG, Giorgetti L, Okamoto I, Servant N, Piolot T, van Berkum NL, Meisig J, Sedat J, et al. 2012. Spatial partitioning of the regulatory landscape of the X-inactivation centre. Nature 485: 381–385. 10.1038/nature11049 [DOI] [PMC free article] [PubMed] [Google Scholar]
- Nora EP, Goloborodko A, Valton A-L, Gibcus JH, Uebersohn A, Abdennur N, Dekker J, Mirny LA, Bruneau BG. 2017. Targeted degradation of CTCF decouples local insulation of chromosome domains from genomic compartmentalization. Cell 169: 930–944.e22. 10.1016/j.cell.2017.05.004 [DOI] [PMC free article] [PubMed] [Google Scholar]
- Olins AL, Olins DE. 1974. Spheroid chromatin units (ν bodies). Science 183: 330–332. 10.1126/science.183.4122.330 [DOI] [PubMed] [Google Scholar]
- Ono T, Losada A, Hirano M, Myers MP, Neuwald AF, Hirano T. 2003. Differential contributions of condensin I and condensin II to mitotic chromosome architecture in vertebrate cells. Cell 115: 109–121. 10.1016/S0092-8674(03)00724-4 [DOI] [PubMed] [Google Scholar]
- Oomen ME, Hansen AS, Liu Y, Darzacq X, Dekker J. 2019. CTCF sites display cell cycle-dependent dynamics in factor binding and nucleosome positioning. Genome Res 29: 236–249. 10.1101/gr.241547.118 [DOI] [PMC free article] [PubMed] [Google Scholar]
- Pogany GC, Corzett M, Weston S, Balhorn R. 1981. DNA and protein content of mouse sperm. Exp Cell Res 136: 127–136. 10.1016/0014-4827(81)90044-6 [DOI] [PubMed] [Google Scholar]
- Rankin S. 2019. Reconstituting nuclear and chromosome dynamics using Xenopus extracts. Cold Spring Harb Protoc 2019: pdb.top097105. 10.1101/pdb.top097105 [DOI] [PMC free article] [PubMed] [Google Scholar]
- Rao SS, Huntley MH, Durand NC, Stamenova EK, Bochkov ID, Robinson JT, Sanborn AL, Machol I, Omer AD, Lander ES, et al. 2014. A 3D map of the human genome at kilobase resolution reveals principles of chromatin looping. Cell 159: 1665–1680. 10.1016/j.cell.2014.11.021 [DOI] [PMC free article] [PubMed] [Google Scholar]
- Rao SSP, Huang S-C, Hilaire BGS, Engreitz JM, Perez EM, Kieffer-Kwon K-R, Sanborn AL, Johnstone SE, Bascom GD, Bochkov ID, et al. 2017. Cohesin loss eliminates all loop domains. Cell 171: 305–320.e24. 10.1016/j.cell.2017.09.026 [DOI] [PMC free article] [PubMed] [Google Scholar]
- Sanborn AL, Rao SSP, Huang S-C, Durand NC, Huntley MH, Jewett AI, Bochkov ID, Chinnappan D, Cutkosky A, Li J, et al. 2015. Chromatin extrusion explains key features of loop and domain formation in wild-type and engineered genomes. Proc Natl Acad Sci 112: E6456–E6465. 10.1073/pnas.1518552112 [DOI] [PMC free article] [PubMed] [Google Scholar]
- Schmidt D, Schwalie PC, Wilson MD, Ballester B, Gonçalves A, Kutter C, Brown GD, Marshall A, Flicek P, Odom DT. 2012. Waves of retrotransposon expansion remodel genome organization and CTCF binding in multiple mammalian lineages. Cell 148: 335–348. 10.1016/j.cell.2011.11.058 [DOI] [PMC free article] [PubMed] [Google Scholar]
- Schwarzer W, Abdennur N, Goloborodko A, Pekowska A, Fudenberg G, Loe-Mie Y, Fonseca NA, Huber W, Haering CH, Mirny L, et al. 2017. Two independent modes of chromatin organization revealed by cohesin removal. Nature 551: 51–56. 10.1038/nature24281 [DOI] [PMC free article] [PubMed] [Google Scholar]
- Shi Z, Xu J, Niu L, Shen W, Yan S, Tan Y, Quan X, Cheung E, Huang K, Chen Y, et al. 2023. Evolutionarily distinct and sperm-specific supersized chromatin loops are marked by Helitron transposons in Xenopus tropicalis. Cell Rep 42: 112151. 10.1016/j.celrep.2023.112151 [DOI] [PubMed] [Google Scholar]
- Shin H, Liu T, Manrai AK, Liu XS. 2009. CEAS: cis-regulatory element annotation system. Bioinformatics 25: 2605–2606. 10.1093/bioinformatics/btp479 [DOI] [PubMed] [Google Scholar]
- Steger K. 1999. Transcriptional and translational regulation of gene expression in haploid spermatids. Anat Embryol (Berl) 199: 471–487. 10.1007/s004290050245 [DOI] [PubMed] [Google Scholar]
- Vallot A, Tachibana K. 2020. The emergence of genome architecture and zygotic genome activation. Curr Opin Cell Biol 64: 50–57. 10.1016/j.ceb.2020.02.002 [DOI] [PMC free article] [PubMed] [Google Scholar]
- Vara C, Paytuví-Gallart A, Cuartero Y, Le Dily F, Garcia F, Salvà-Castro J, Gómez-H L, Julià E, Moutinho C, Cigliano RA, et al. 2019. Three-dimensional genomic structure and cohesin occupancy correlate with transcriptional activity during spermatogenesis. Cell Rep 28: 352–367.e9. 10.1016/j.celrep.2019.06.037 [DOI] [PMC free article] [PubMed] [Google Scholar]
- Vietri Rudan M, Barrington C, Henderson S, Ernst C, Odom DT, Tanay A, Hadjur S. 2015. Comparative Hi-C reveals that CTCF underlies evolution of chromosomal domain architecture. Cell Rep 10: 1297–1309. 10.1016/j.celrep.2015.02.004 [DOI] [PMC free article] [PubMed] [Google Scholar]
- Waizenegger IC, Hauf S, Meinke A, Peters JM. 2000. Two distinct pathways remove mammalian cohesin from chromosome arms in prophase and from centromeres in anaphase. Cell 103: 399–410. 10.1016/S0092-8674(00)00132-X [DOI] [PubMed] [Google Scholar]
- Wang Y, Wang H, Zhang Y, Du Z, Si W, Fan S, Qin D, Wang M, Duan Y, Li L, et al. 2019. Reprogramming of meiotic chromatin architecture during spermatogenesis. Mol Cell 73: 547–561.e6. 10.1016/j.molcel.2018.11.019 [DOI] [PubMed] [Google Scholar]
- Ward WS, Coffey DS. 1991. DNA packaging and organization in mammalian spermatozoa: comparison with somatic cells. Biol Reprod 44: 569–574. 10.1095/biolreprod44.4.569 [DOI] [PubMed] [Google Scholar]
- Wendt KS, Yoshida K, Itoh T, Bando M, Koch B, Schirghuber E, Tsutsumi S, Nagae G, Ishihara K, Mishiro T, et al. 2008. Cohesin mediates transcriptional insulation by CCCTC-binding factor. Nature 451: 796–801. 10.1038/nature06634 [DOI] [PubMed] [Google Scholar]
- Wilkins BJ, Rall NA, Ostwal Y, Kruitwagen T, Hiragami-Hamada K, Winkler M, Barral Y, Fischle W, Neumann H. 2014. A cascade of histone modifications induces chromatin condensation in mitosis. Science 343: 77–80. 10.1126/science.1244508 [DOI] [PubMed] [Google Scholar]
- World Health Organization. 2010. WHO laboratory manual for the examination and processing of human semen, 5th ed. World Health Organization, Geneva. [Google Scholar]
- Wutz G, Várnai C, Nagasaka K, Cisneros DA, Stocsits RR, Tang W, Schoenfelder S, Jessberger G, Muhar M, Hossain MJ, et al. 2017. Topologically associating domains and chromatin loops depend on cohesin and are regulated by CTCF, WAPL, and PDS5 proteins. EMBO J 36: 3573–3599. 10.15252/embj.201798004 [DOI] [PMC free article] [PubMed] [Google Scholar]
- Yeong FM, Hombauer H, Wendt KS, Hirota T, Mudrak I, Mechtler K, Loregger T, Marchler-Bauer A, Tanaka K, Peters J-M, et al. 2003. Identification of a subunit of a novel kleisin-β/SMC complex as a potential substrate of protein phosphatase 2A. Curr Biol 13: 2058–2064. 10.1016/j.cub.2003.10.032 [DOI] [PubMed] [Google Scholar]
- Yin Q, Yang C-H, Strelkova OS, Wu J, Sun Y, Gopalan S, Yang L, Dekker J, Fazzio TG, Li XZ, et al. 2023. Revisiting chromatin packaging in mouse sperm. Genome Res (this issue) 33: 2079–2093. 10.1101/gr.277845.123 [DOI] [PMC free article] [PubMed] [Google Scholar]
- Zhang H, Emerson DJ, Gilgenast TG, Titus KR, Lan Y, Huang P, Zhang D, Wang H, Keller CA, Giardine B, et al. 2019. Chromatin structure dynamics during the mitosis-to-G1 phase transition. Nature 576: 158–162. 10.1038/s41586-019-1778-y [DOI] [PMC free article] [PubMed] [Google Scholar]
- Zhang H, Shi Z, Banigan EJ, Kim Y, Yu H, Bai X-C, Finkelstein IJ. 2023. CTCF and R-loops are boundaries of cohesin-mediated DNA looping. Mol Cell 83: 2856–2871.e8. 10.1016/j.molcel.2023.07.006 [DOI] [PubMed] [Google Scholar]
Associated Data
This section collects any data citations, data availability statements, or supplementary materials included in this article.