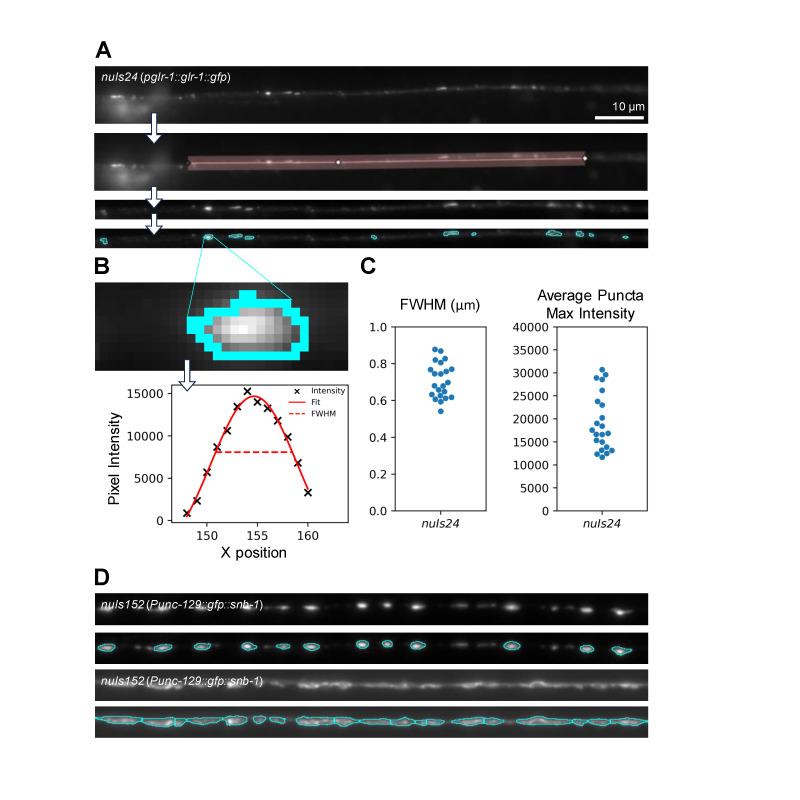
Figure 1. Identification and analysis of puncta using Fiji.
A. The Fiji macro straightens a user-defined line-scan to identify fluorescent puncta based on parameters that can be used across datasets. B. An intensity profile of the punctum outlined in cyan. Puncta that are defined using the Fiji macro are analyzed so that data about intensity (X) and width (Full-Width at Half-Maximal intensity, (FWHM), dashed line) can be recorded and output as a CSV file. C. Example data from ventral nerve cords in animals expressing GLR-1::GFP under the control of the glr-1 promoter ( nuIs24 ), N = 22. D. Comparison of puncta identification from a sample with distinct puncta (top two panels) and a sample with puncta that are less distinct from the nerve cord (bottom two panels). Images are from dorsal nerve cords in animals expressing GFP::SNB-1 under the control of the unc-129 promoter ( nuIs152 ).

