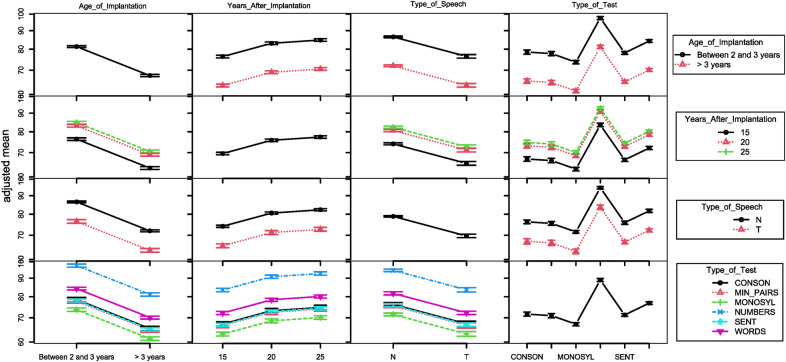
Figure 6.
Interaction plot for the several factors with potential influence in the test results. The following are presented, from left to right (and top to bottom): age of implantation (2 groups), time of evaluation years after implantation, type of speech (T for telephonic speech, N otherwise), and type of test.

