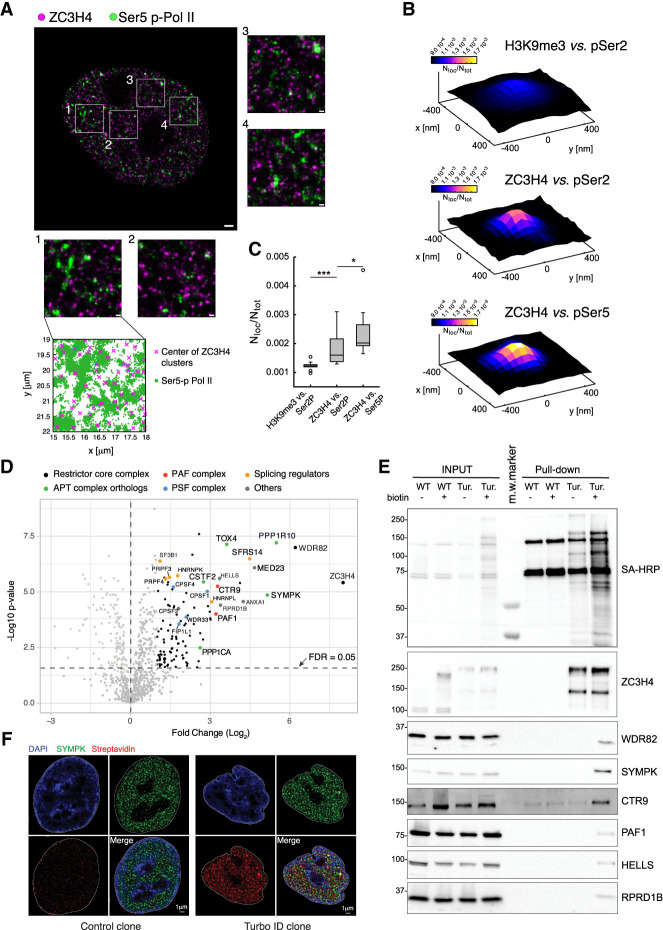
Figure 1.
A high-stringency ZC3H4 proximity interactome. (A) dSTORM image of a representative nucleus of HeLa cells stained with anti-ZC3H4 (magenta) and anti-pSer5 CTD Pol II (green) antibodies. Magnified images corresponding to the four boxed regions are also shown. At the bottom, the distribution of the pSer5 Pol II localizations relative to the centers of ZC3H4 clusters in one area is shown. Scale bars indicate 1 µm for the whole nuclei and 200 nm for the boxed regions. (B) Partial colocalization analysis of pSer2/pSer5 Pol II localizations around ZC3H4 clusters in STORM data. pSer2 and pSer5 Pol II localizations were mapped in a 30-nm grid, and the ZC3H4 clusters where the pSer2 or pSer5 Pol II density was higher than its own average density (i.e., ∼30% of clusters) were identified. The cumulative pSer2 and pSer5 Pol II nuclear map around ZC3H4 clusters was computed, the signal was normalized by the total map intensity, and the value of at least 15 nuclei was averaged. Position (0,0) in the plot represents the center of ZC3H4 clusters, and the intensity is the pSer2 or pSer5 Pol II normalized signal, which is proportional to the probability of finding the signal in that spatial position. (C) Box plots represent the colocalization strength; i.e., the average normalized signal of the pSer2 or pSer5 Pol II within 30 nm from the ZC3H4 cluster center. Every point represents the colocalization strength for a single nuclear map. As a control, we performed the same analysis for H3K9me3 localizations around pSer2 Pol II clusters. (D) Volcano plot showing the proteins identified by proximity labeling in HCT116 cells carrying a ZC3H4-Turbo-ID fusion gene. Biotin was added for 10 min to biotin-depleted cells, followed by the preparation of total lysates, streptavidin pull-down, and mass spectrometry. The identified proteins are shown according to their relative abundance (log2 fold change) and statistical significance in ZC3H4-TurboID cells versus biotin-treated wild-type cells. Proteins belonging to different complexes are indicated with different colors. n = 5 independent biological replicates. Significant hits are indicated as black dots. (E) Western blot analysis of selected proteins identified by proximity labeling in ZC3H4-TurboID cells. The top panel shows the detection of the pulled-down material by Western blot with streptavidin-HRP (SA-HRP). Input lysates and pulled-down proteins are shown. Molecular weight markers (in kilodaltons) are indicated at the left. Note the presence of a few biotinylated proteins in WT cells, which represent the three known endogenously biotinylated, long-half-life carboxylases (pyruvate carboxylase, 130 kDa; 3-methylcrotonyl CoA carboxylase, 75 kDa; and propionyl CoA carboxylase, 72 kDa) (Chandler and Ballard 1986; Ahmed et al. 2014). (F) DeepSIM superresolution images of representative nuclei from wild-type cells (control) and a ZC3H4-TurboID knock-in HCT116 clone (Turbo-ID) stained with an anti-Symplekin antibody (green) and streptavidin (red). Nuclear counterstaining with DAPI and a merged image are also shown.

