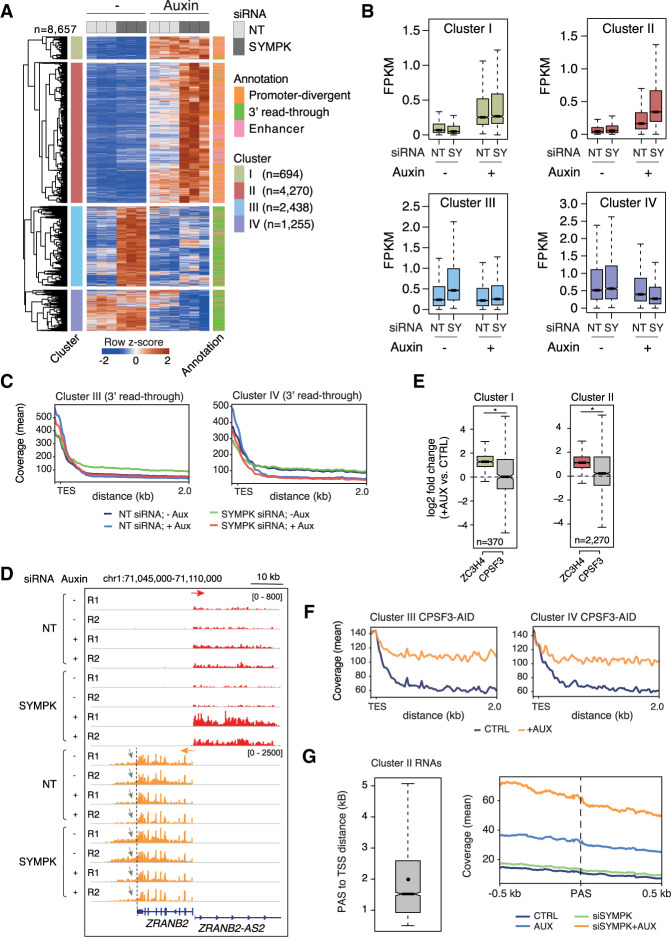
Figure 2.
Transcriptional effects of combined ZC3H4 depletion and partial siRNA-mediated Symplekin depletion. (A) Heat map showing extragenic transcripts differentially expressed in auxin-treated (ZC3H4-depleted) and/or SYMPK siRNA transduced HCT116 cells (FDR ≤ 0.05, |log2FC| ≥ 0.8, FPKM mean value ≥ 0.1). Row Z-scores are shown. Four clusters (I–IV from top to bottom) were identified that were characterized by different responses to ZC3H4 and/or Symplekin depletion. Each transcript was assigned to the nearest enhancer, promoter, or gene 3′ end (annotation flags at the right). Data are from n = 3 independent biological replicates. (B) Signal intensity of differentially expressed extragenic transcripts in clusters I–IV in the different experimental conditions used. The median value is indicated by a horizontal black line. Boxes show values between the first and third quartiles. The top and bottom whiskers show the smallest and the highest values, respectively. Outliers are not shown. The notches correspond to ∼95% confidence interval for the median. (C) Metaplots of transcripts in clusters III and IV, showing the effects of different perturbations on readthrough transcription at genes’ 3′ ends. (TES) Transcription end site. (D) A representative genomic region showing the effects of auxin-driven ZC3H4 depletion and partial siRNA-mediated Symplekin depletion on the ZRANB2 gene promoter-divergent transcription (ZRANB2-AS2) and on readthrough transcription (indicated by gray arrows) at the 3′ end of the ZRANB2 gene. The red and orange arrows indicate the plus and the minus strand signals, respectively. (E) Effects of auxin-induced CPSF3 depletion on promoter-divergent transcripts assigned to clusters I and II. Log2FC in auxin-treated versus untreated cells is shown. The effects of ZC3H4 depletion are shown for comparison. Statistical significance was assessed by a Wilcoxon paired test (cluster I, P = 2.732294 × 10⁻¹⁹; cluster II, P = 4.253707 × 10−65). (F) Metaplot showing the effects of auxin-induced CPSF3 depletion on readthrough transcripts assigned to clusters III and IV. Data from TES + 2 kb are shown; one bin = 20 bp. (G) Abundance of nascent extragenic transcripts synergistically regulated by ZC3H4 and Symplekin in a window of ±500 nt before and after the first PAS. We considered transcripts belonging to cluster II overlapping with a PRO-seq peak (n = 3090), which was used for the accurate identification of the main TSS. After removing transcripts with the first PAS at <500 nt from the TSS, we retained n = 2335 transcripts and measured the distance between their TSSs and the first PAS. (Left) The distance between the start of the PRO-seq peaks and the PAS is shown in a box plot. The mean (2002 nt) is shown as a dot. Median = 1522 nt. (Right) The coverage around the PAS (±500 nt) is shown in a metaplot.

