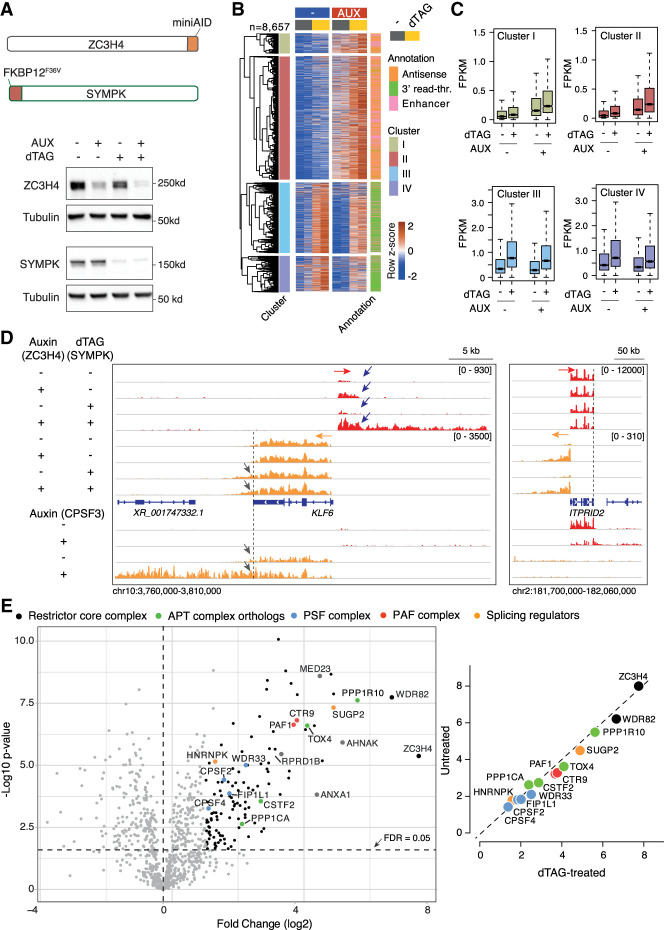
Figure 3.
Transcriptional effects of dTAG-induced depletion of Symplekin in combination with auxin-driven ZC3H4 depletion. (A, top) Schematic representation of the ZC3H4 and SYMPK degron knock-in alleles (not to scale). (Bottom) Depletion of ZC3H4 and Symplekin in double-knock-in HCT116 cells upon treatment with 100 µM auxin and/or 500 nM dTAG for 24 h. Molecular weight markers are shown at the right. (B) Heat map showing extragenic transcripts differentially expressed in auxin-treated (ZC3H4-depleted) and/or dTAG-treated (Symplekin-depleted) HCT116 cells. Row Z-scores are shown. The four clusters (I–IV) indicated in the heat map correspond to those in Figure 2A. Data are from n = 2 independent biological replicates. (C) Signal intensity of differentially expressed extragenic transcripts in clusters I–IV in the indicated experimental conditions. The median value is indicated by a horizontal black line. Boxes show values between the first and third quartiles. The top and bottom whiskers show the smallest and the highest values, respectively. Outliers are not shown. The notches correspond to ∼95% confidence interval for the median. (D) Two representative genomic regions showing the effects of individual or combined degron-driven degradation of Symplekin (dTAG) and ZC3H4 (auxin) on promoter-divergent (plus strand; red) and 3′ readthrough transcription (minus strand; orange). For comparison, the effects of auxin-mediated CPSF3 depletion in the same regions are shown at the bottom. (E, left) Volcano plot showing the proteins identified by proximity labeling upon dTAG-driven Symplekin depletion in HCT116 cells carrying a ZC3H4-Turbo ID fusion gene. The identified proteins are shown according to their relative abundance (log2 fold change) and statistical significance in ZC3H4-Turbo-ID cells versus biotin-treated control cells. n = 5 independent biological replicates. Significant hits are indicated as black dots. Selected statistically significant proteins are indicated in different colors depending on the functional group or complex to which they belong. (Right) Correlation between protein enrichment in mass spectrometry experiments in untreated versus dTAG-treated cells. Data are shown as fold enrichment (log2) in ZC3H4-Turbo-ID cells relative to wild-type cells.

