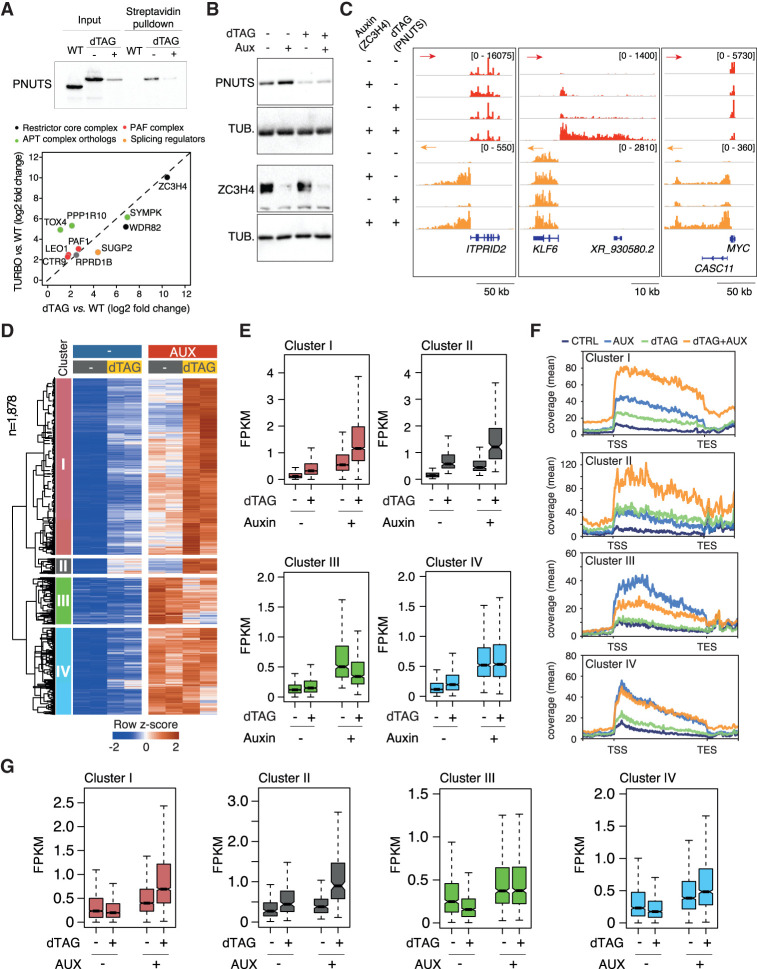
Figure 6.
Effects of individual and combined depletions of ZC3H4 and PNUTS on extragenic transcription termination. (A) Effects of PNUTS depletion on the proximity interactome of ZC3H4. A dTAG-regulated degron was inserted into both PPP1R10 alleles in ZC3H4-Turbo-ID cells, and the proximity interactome of ZC3H4 was determined before and after PNUTS depletion. (Top) Western blot showing the depletion of degron-containing PNUTS upon dTAG treatment. (Bottom) Volcano plot showing selected proteins identified by proximity labeling upon dTAG-driven PNUTS depletion. The complete list of proteins is in Supplemental Table S8. (B) Levels of PNUTS and ZC3H4 after individual or combined degron-mediated depletion were analyzed by Western blot. Tubulin was used as a loading control. (C) Representative 4sU RNA-seq snapshots showing extragenic transcription changes induced by individual and combined depletion of ZC3H4 and PNUTS. The red and orange arrows indicate the plus and minus strand signals, respectively. (D) Clustered extragenic transcripts differentially expressed in the indicated depletions. The heat map includes promoter-divergent and enhancer-associated RNAs. Row Z-scores are shown. All transcripts in the heat map are significant in both clones in the ZC3H4-depleted condition versus control (FDR ≤ 0.01 and log2 transformed fold change of ≥2). The complete list of differentially expressed transcripts is in Supplemental Table S9. Cluster I: n = 1009, cluster II: n = 89, cluster III: n = 271, cluster IV: n = 509. Data are from n = 2 biological replicates of a single clone. (E) Levels (FPKM) of differentially expressed transcripts in the four clusters. The median value is indicated by a horizontal black line. Boxes show values between the first and third quartiles. The bottom and top whiskers show the smallest and highest values, respectively. Outliers are not shown. The notches correspond to ∼95% confidence interval for the median. (F) The metaplot shows the replicate average of the 4sU-seq signal in the four clusters of extragenic transcription units in C. (TSS) Transcription start site, (TES) transcription end site. (G) The levels of transcripts in clusters I–IV were measured in data sets obtained from cells depleted of Symplekin (by dTAG-mediated degradation) and/or ZC3H4 (by auxin-mediated degradation).

