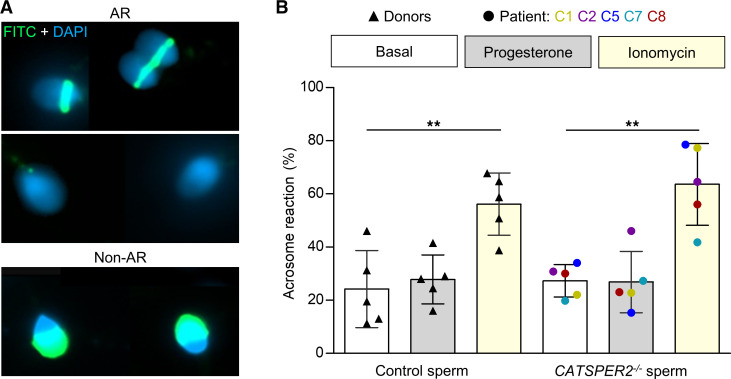
Figure 10. Acrosome reaction of control and CATSPER2–/– sperm.
(A) Representative fluorescence images of capacitated nonacrosome reacted (non-AR) and acrosome reacted (AR) control sperm from donors stained with DAPI (blue) and FITC-labelled peanut agglutinin (PNA) lectin. (B) Scatter plot of the fraction (mean ± SD) of acrosome-reacted control (black triangles, n = 5) and CATSPER2–/– sperm (color coded, n = 5) after incubation in HTF++ (basal; white), progesterone (5 μM; gray), or ionomycin (5 μM; yellow). Experiments were performed with sperm incubated under capacitating conditions. **P < 0.01, ANOVA with Bonferroni’s multiple comparisons test versus the respective basal values.

