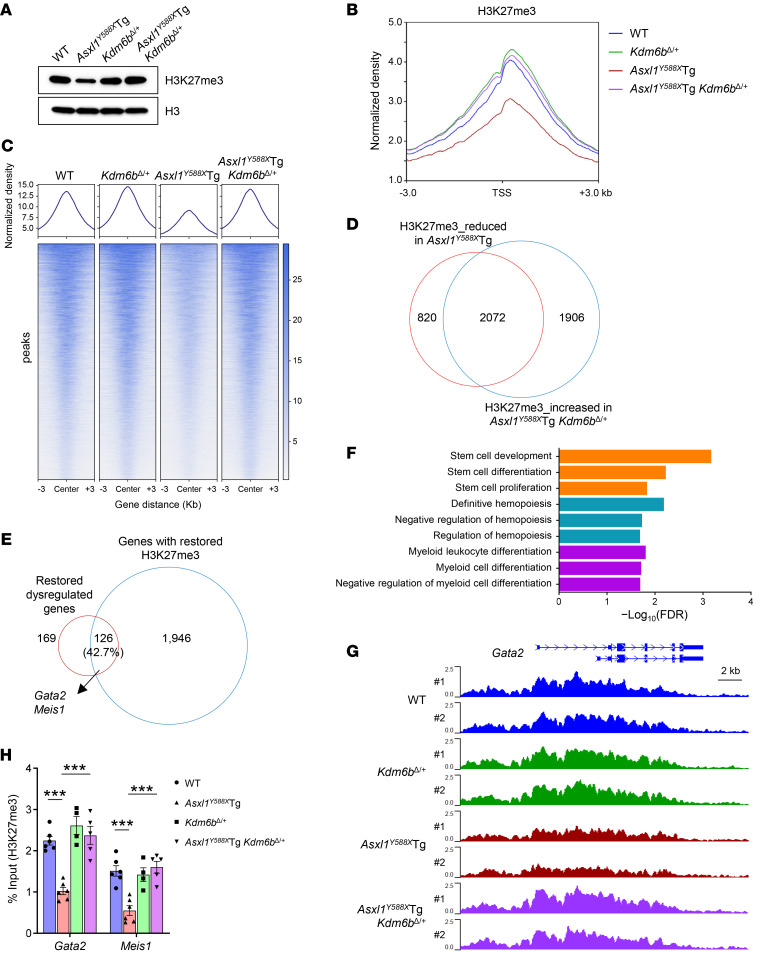
Figure 5. Genetic reduction of Kdm6b in Asxl1Y588XTg mice normalizes the levels of dysregulated genes by restoring H3K27me3 levels.
(A) Western blot showing the levels of H3K27me3 in BM cells from representative mice of each genotype. (B) Global levels of H3K27me3 at transcription start site (TSS) and 3-kb regions surrounding TSS. The coverages were normalized by the sequencing depth and averaged in 2 biological replicates. (C) Heatmaps of normalized H3K27me3 ChIP-Seq read densities centered on the midpoints of 6,305 H3K27me3-changed regions (FDR < 0.05). Each row represents a single region. (D) Venn diagram showing the overlap of genes between reduced H3K27me3 in Asxl1Y588XTg (compared with WT controls) and increased H3K27me3 in Asxl1Y588XTg Kdm6bΔ/+ LK cells (compared with Asxl1Y588XTg). The number of genes in each section of the diagram is shown. (E) Venn diagram showing the overlap between genes with restored H3K27me3 (D) and restored dysregulated genes (in Figure 4B) in LK cells. The number of genes in each section of the diagram is shown. (F) Functional enrichment analysis for 126 overlapping genes in E. Representative significantly enriched pathways are displayed (FDR < 0.05). (G) Normalized H3K27me3 signals on the Gata2 gene loci are shown. (H) ChIP-qPCR verified the reduction of H3K27me3 occupancies at the promoter regions of Gata2 and Meis1 genes (n = 4–6 mice per genotype). Data represent the mean ± SEM. ***P < 0.001, by 1-way ANOVA with Tukey’s multiple-comparison test.

