Figure 5:

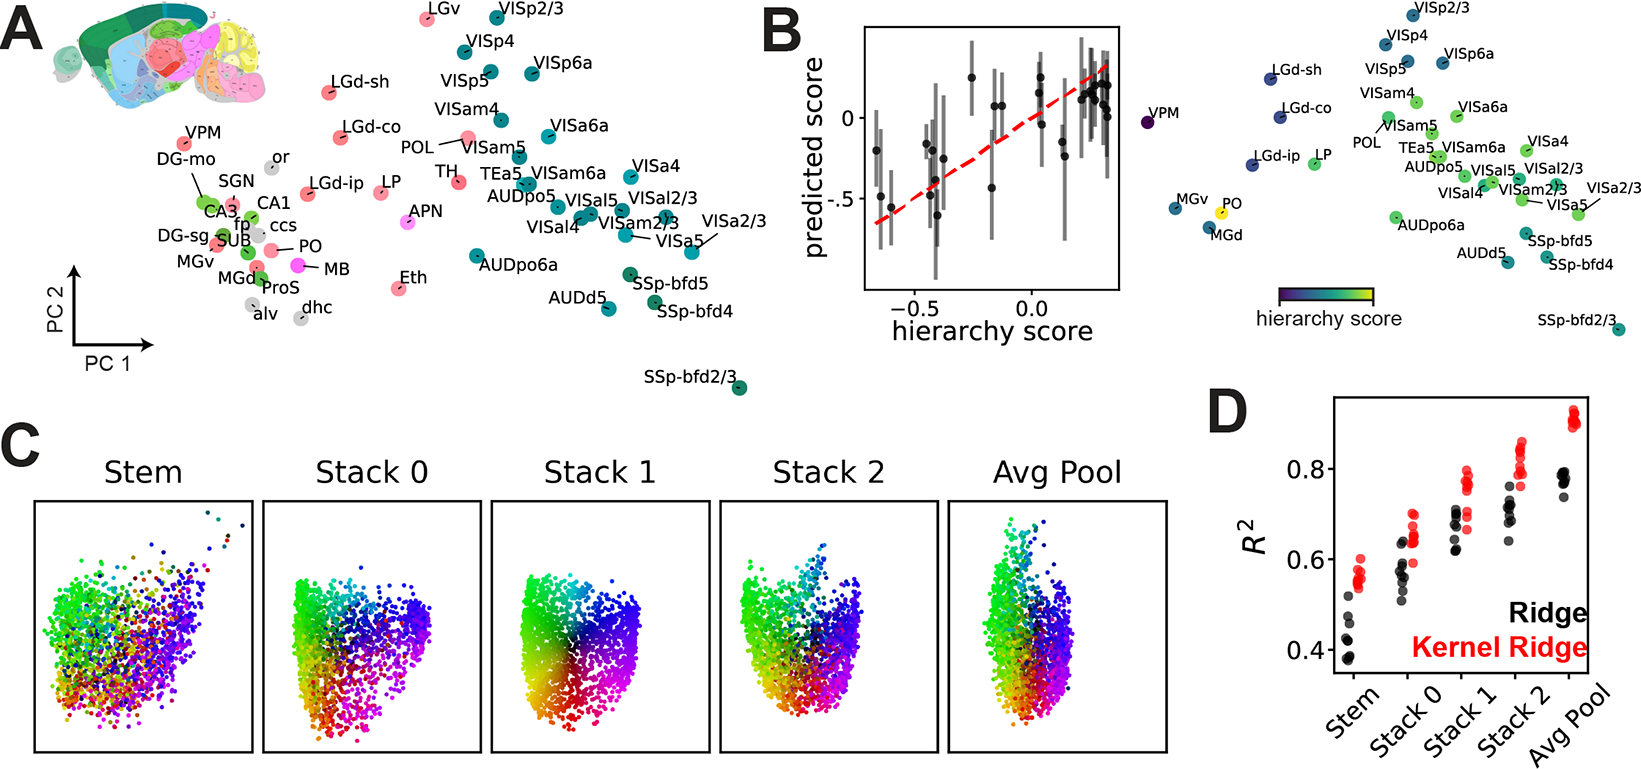
(A) PCA visualization of representations across 48 brain regions in the ABO dataset. Areas are colored by the reference atlas (see inset), illustrating a functional clustering of regions that maps onto anatomy. (B) Left, kernel regression predicts anatomical hierarchy [48] from embedded representations (see Supplement E). Right, PCA visualization of 31 areas labeled with hierarchy scores. (C) PCA visualization of 2000 network representations (a subset of NAS-Bench-101) across five layers, showing global structure is preserved across layers. Each network is colored by its position in the “Stack 1” layer (the middle of the architecture). (D) Embeddings of NAS-Bench-101 representations are predictive of test set accuracy, even in very early layers.
