
Figure 1.
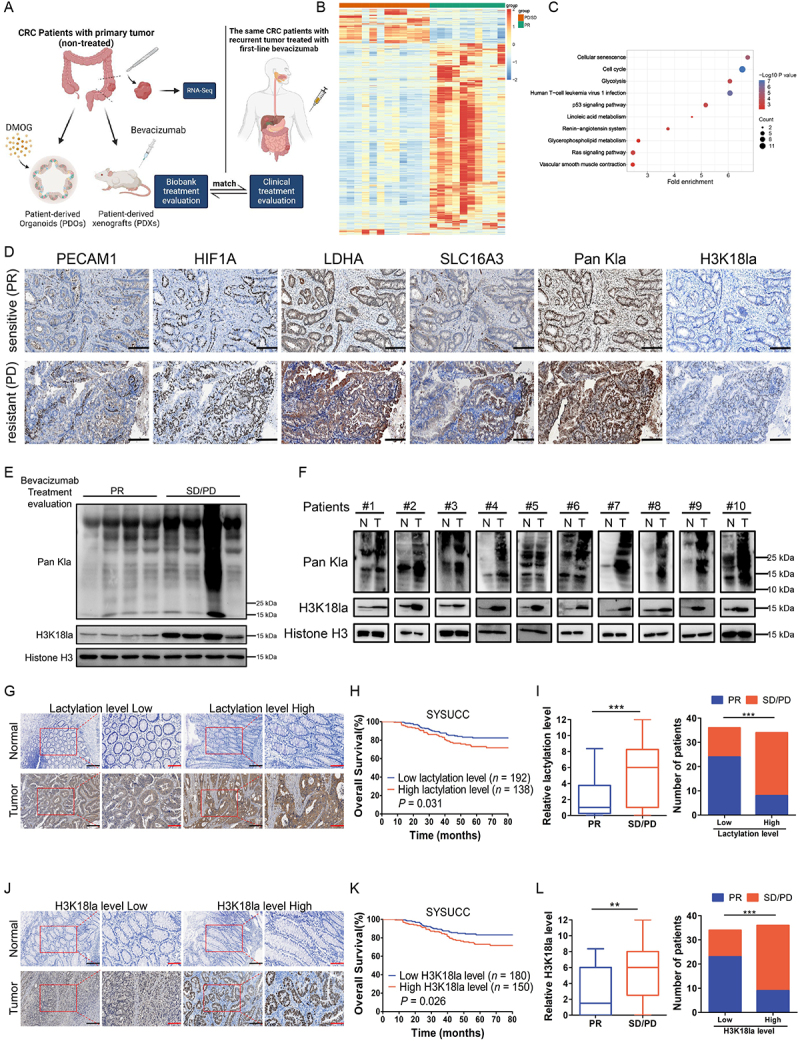
Colorectal cancer (CRC) resistance to bevacizumab treatment exhibited increased lactylation levels which was associated with poor survival in CRC patients.
Note: (A) Schematic description of biobank construction and CRC patients cohort administration. (B) Heatmap of 1,554 differentially expressed genes in bevacizumab treated SD/PD (red) and PR (green) CRC patients (1,285 downregulated and 269 upregulated in SD/PD versus PR (n = 12 and 10; all absolute log2 fold change > 0.5, false discovery rate (FDR) <10%); PD, progressive disease; SD, stable disease; and PR, partial response. (C) Kyoto Encyclopedia of Genes and Genomes (KEGG) analysis of top 1,000 significantly (FDR <5%) upregulated genes of SD/PD versus PR. (D) Representative Paraffin-embedded tumor sections derived from patient-derived xenografts (PDXs) mice (PDX #1-bevacizumab treated sensitive (PR) and PDX #6-bevacizumab treated resistant (PD)) were stained with PECAM1, HIF1A, LDHA, SLC16A3, Pan Kla or H3K18la antibodies (scale bar: 200 μm). (E) Western blotting analysis showing the levels of lactylation or H3K18la in 8 primary tumor tissues reserved before relapse from CRC patients who were treated with first-line bevacizumab treatment after recurrence, including 4 samples from patients with bevacizumab treated SD/PD and 4 samples from patients with bevacizumab treated PR. (F) Western blotting analysis of lactylation or H3K18la levels in 10 matched CRC tissues (T) and adjacent noncancerous tissues (N). (G and J) Two representative cases show high compared with low levels of lactylation (G) or H3K18la (J) in human CRC tumor tissues and adjacent normal tissues analyzed by immunohistochemistry (IHC) staining (scale bar: black, 200 μm; red, 100 μm;). (H and K) The overall survival curves of CRC patients in the SYSUCC cohort with low and high lactylation (H) or H3K18la (K) levels are generated using the Kaplan-Meier method and the log-rank test; SYSUCC, Sun Yat-sen University Cancer Center. (I and L) Statistics of relative lactylation (I) or H3K18la levels (L) in CRC patients with bevacizumab treated PR (n = 32) or bevacizumab treated SD/PD (n = 38) (left) and number of CRC patients with PR or SD/PD in low or high lactylation (I) or H3K18la levels (L) groups (right); **P ≤0.01, ***P ≤0.001, by Mann-Whitney test (left), or Chi-Square test (right).