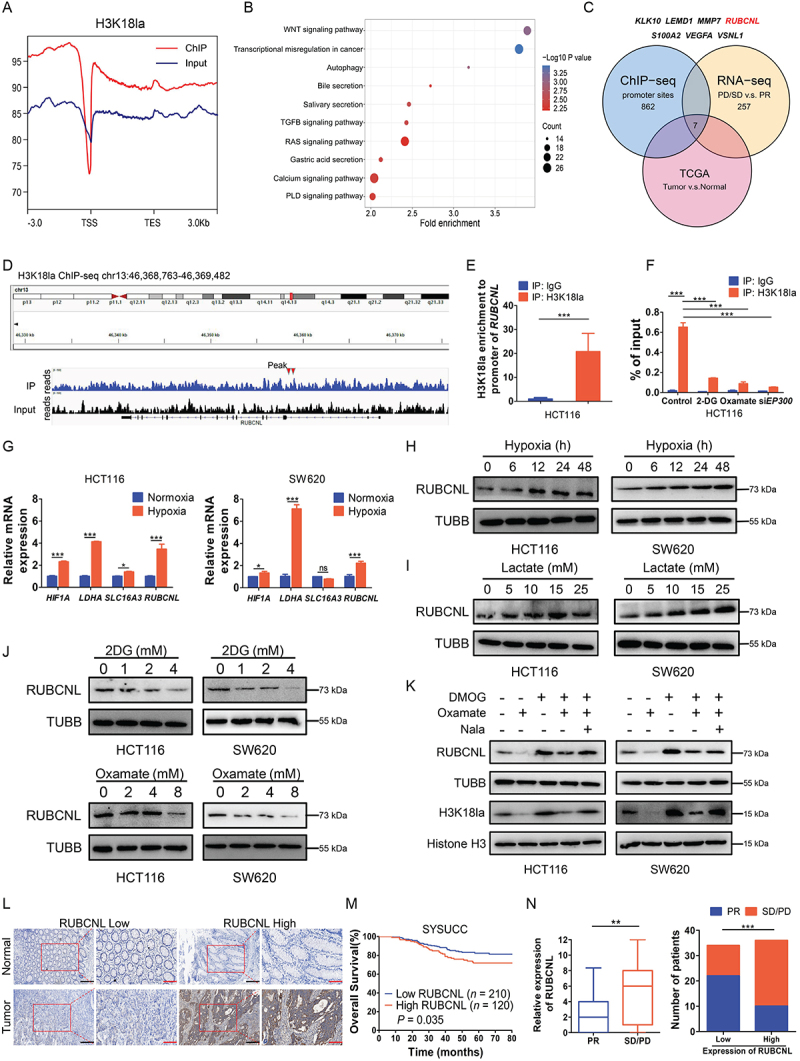
Figure 3.

Histone lactylation activated RUBCNL transcription in colorectal cancer.
Note: (A) Distribution of H3K18la sites relative to translation start site (TSS). (B) Kyoto Encyclopedia of Genes and Genomes (KEGG) analysis of H3K18la peaks. (C) Strategy to identify potential specific downstream targets of H3K18la modification. (D) Representative IGV tracks showing enriched H3K18la modification in RUBCNL promotor by ChIP-seq. Arrows are the H3K18la peaks at the RUBCNL promotor. (E) DNA fragments from HCT116 cells were immunoprecipitated with the H3K18la-specific antibody and analyzed by qPCR using the indicated primers. ***P ≤0.001. (F) ChIP-qPCR analysis for H3K18la status at the RUBCNL promotor of HCT116 cells treated with 4 mM 2-DG, 8 mM oxamate or transiently transfected with siRNAs targeting EP300 for 24 h. ***P ≤0.001. (G) Expression of HIF1A, LDHA, SLC16A3 and RUBCNL were detected in HCT116 and SW620 cells in normoxia or hypoxia (1% oxygen) for 24 h by RT-qPCR. ns, no significance, *P ≤0.05, ***P ≤0.001. (H) Western blotting analysis of RUBCNL expression in HCT116 and SW620 cells cultured in hypoxia (1% oxygen) at the indicated time. (I) Western blotting analysis of RUBCNL expression in HCT116 and SW620 cells cultured in different concentrations of lactate for 24 h. (J) Western blotting analysis of RUBCNL expression in HCT116 and SW620 cells cultured in different concentrations of 2-DG or oxamate for 24 h. (K) Western blotting analysis of RUBCNL expression and H3K18la levels in HCT116 and SW620 cells treated with 2 mM DMOG, 8 mM oxamate or 5 mM Nala for 24 h. (L) Two representative cases show high compared with low RUBCNL expression in human CRC tumor tissues and adjacent normal tissues analyzed by immunohistochemistry (IHC) staining (scale bar: black, 200 μm; red, 100 μm;). (M) The overall survival curves of CRC patients in the SYSUCC cohort cohort with low and high RUBCNL expression are generated using the Kaplan-Meier method and the log-rank test. (N) Statistics of relative RUBCNL expression in CRC patients with bevacizumab treated PR (n = 32) or bevacizumab treated SD/PD (n = 38) (left) and number of CRC patients with PR or SD/PD in low or high RUBCNL expression groups (right); **P ≤0.01, ***P ≤0.001, by Mann-Whitney test (left), or Chi-Square test (right).
