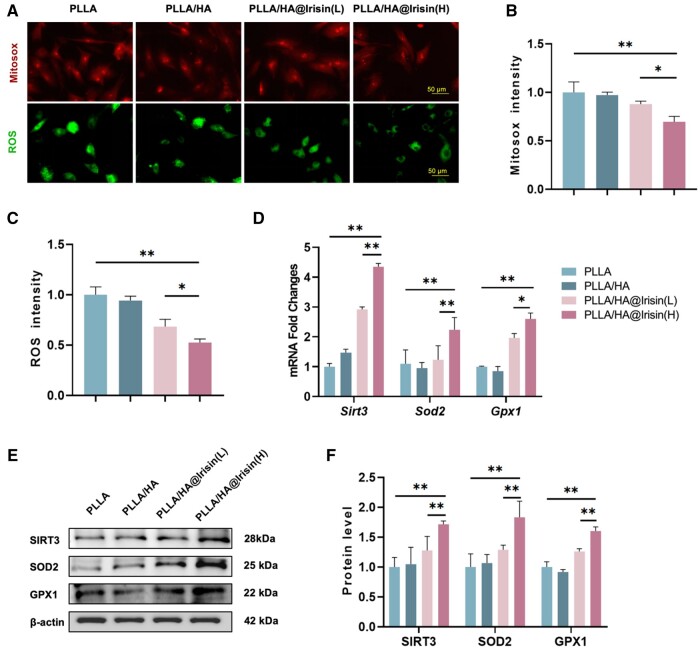
Figure 6.
PLLA/HA@Irisin membranes enhanced the antioxidant functions of BMMSCs. (A) Mitochondrial and intracellular ROS were detected through MitoSOX and DCFH-DA staining, respectively. Scale bar = 50 μm. (B) Quantification of mitochondrial ROS in BMMSCs, n = 3. (C) Quantification of intracellular ROS in BMMSCs, n = 3. (D) The gene expression of Sirt3, Sod2 and Gpx1 was determined by RT-PCR. (E, F) Western blot was used to determine the protein levels of SIRT3, SOD2 and GPX1. Statistically significant differences were indicated by *P < 0.05 or **P < 0.01.

