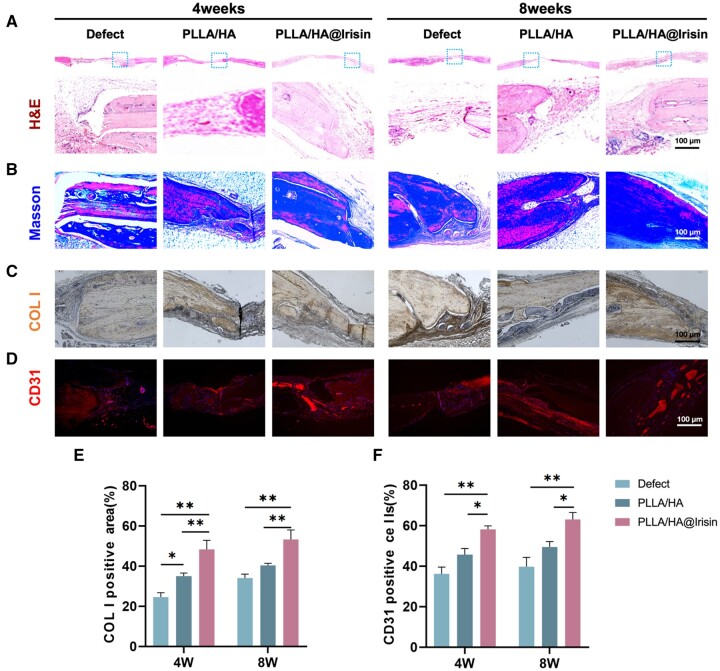
Figure 8.
Histological and immunohistochemical analysis of the newly formed bone tissue in the calvarial defects. (A) H&E images of the defect area at 4 and 8 weeks post-surgery. (B) MTS images of the defect area at 4 and 8 weeks post-surgery. (C) IHC images of COL I in the defect area. (D) IHC images of CD31-positive cells that represented the newly formed blood vessels. Scale bar = 100 μm. (E) Quantification of the COL I-positive area, n = 3. (F) Quantification of the CD31-positive cells, n = 3. Statistically significant differences are indicated by *P < 0.05 or **P < 0.01.

