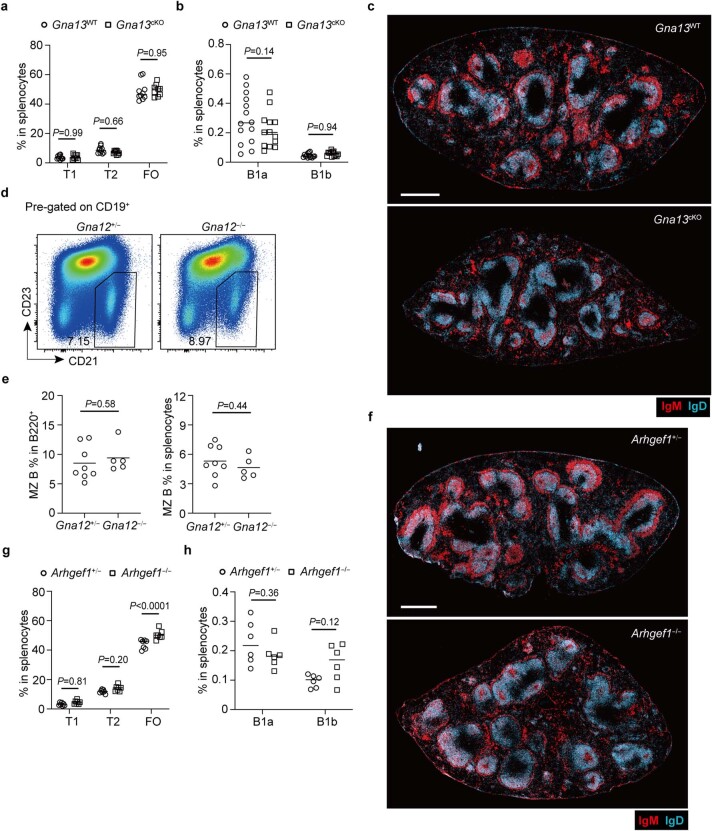
Extended Data Fig. 3. Selective Gα13-ArhGEF1 requirements of splenic B cells.
a, Frequencies of T1, T2 and FO B cells in total splenocytes in Gna13cKO (n = 9) and control (n = 10) mice. b, Frequencies of B1a and B1b cells in total splenocytes in Gna13cKO (n = 13) and control (n = 14) mice. c, Representative distribution patterns of IgMhi MZ B (red) relative to IgDhi FO B cells (blue) in full spleen cross-sections from mice of the indicated genotypes. Scale bar, 500 μm. d,e, Representative flow cytometry profiles (d) and frequencies of MZ B in total CD19+ B cells (e left panel), and in total splenocytes (e right panel) in Gna12−/− (n = 8) and control (n = 5) chimeras. f, Representative distribution patterns of IgMhi MZ B (red) relative to IgDhi FO B cells (blue) in full spleen cross-sections from mice of the indicated genotypes. Scale bar, 500 μm. g, Frequencies of T1, T2 and FO B cells in total splenocytes in Arhgef1−/− (n = 7) and control (n = 7) mice. h, Frequencies of B1a and B1b cells in total splenocytes in Arhgef1−/− (n = 6) and control (n = 6) mice. Data are pooled from two (a, e, g, h) or three (b) independent experiments. Sections are representative of multiple cross-sections from at least three mice of each type (c, f). Each symbol represents one mouse and lines denote means. Statistical significance was tested by two-way ANOVA followed by Sidak’s multiple comparisons test (a, b, g, h) or two-tailed t-test (e).

