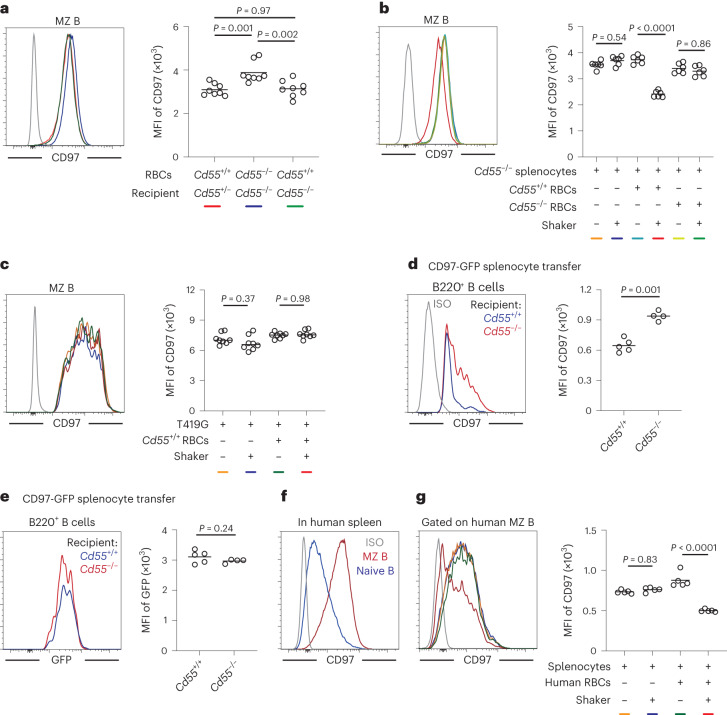
Fig. 5. CD55-mediated CD97 NTF extraction is dependent on shear stress and is conserved in human MZ B cells.
a, Representative histogram (left) and geometric mean fluorescence intensity (MFI; right) of surface CD97 expression on MZ B cells in mice with blood transfusion as indicated (n = 8 recipients in each group). Line colors in the histogram are for mice of the types shown by color code beneath the graph. b,c, Splenocytes from Cd55−/− mice (b; n = 6 in each group) or CD97 T419G-expressing BM chimeras (c; n = 8 in each group) were cocultured for 45 min with Cd55−/− or Cd55+/+ RBCs on a shaker or not. Representative histograms (left) and MFIs (right) of surface CD97 expression on MZ B cells are shown. Line colors in the histograms are for conditions of the types shown by color codes beneath the graphs. Each symbol represents one incubation, and each donor contributes two incubations. d,e, MFI of surface CD97 expression (d) and GFP (e) on transferred MZ B cells from CD97–GFP fusion protein-expressing BM chimeras in blood collected from Cd55−/− (n = 4) or Cd55+/+ (n = 5) recipients after a 30-min transfer as indicated. Each symbol represents one mouse. f, Representative histogram plot of surface CD97 on naive B cells and MZ B cells from the human spleen. g, Representative histogram (left) and MFI (right) of surface CD97 expression on human MZ B cells after incubation for 45 min with human RBCs on a shaker or not (n = 5 in each group). Each symbol represents one incubation, and line colors in the histogram are for conditions of the types shown by color code beneath the graph. Lines in graph denote means. Data are pooled from two independent experiments (a–e) or are representative of two independent experiments (g). Statistical significance was tested by one-way ANOVA followed by Tukey’s multiple-comparisons test (a–c and g) or two-tailed t-test (d and e).

