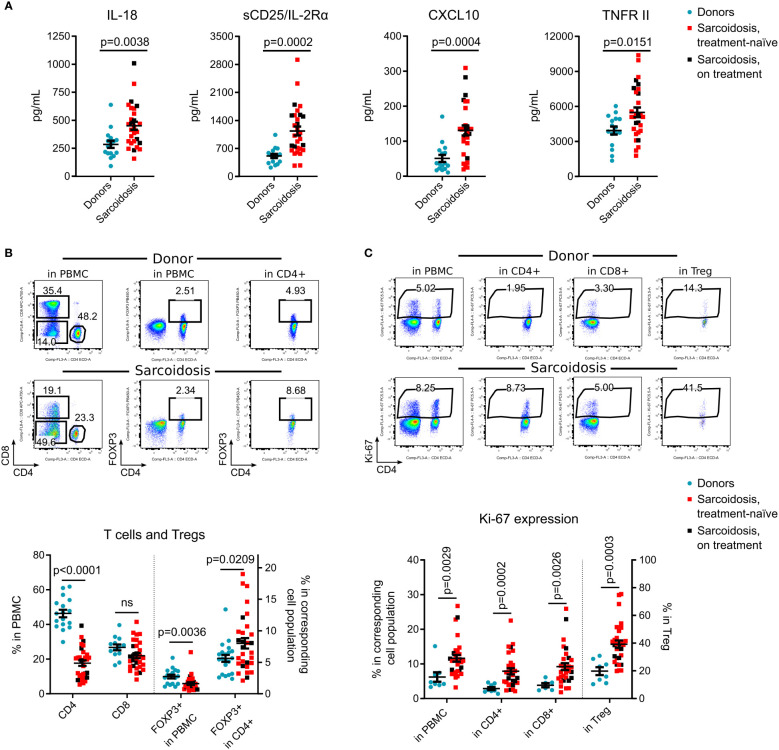
Figure 1.
Immune system alterations in sarcoidosis. (A), Plasma levels of IL-18, sCD25/IL-2Rα, CXCL10 and TNFR II were evaluated by Luminex assay in 29 sarcoidosis patients and 16 donors, matched by age, gender, race, and smoking history, Supplementary Table S2. Additional Luminex data are presented in Supplementary Figure S2A. (B), Percent of CD4+ and CD8+ T cells, and % of CD4+ FOXP3+ Tregs within all viable PMBCs and within CD4+ subsets were evaluated by flow cytometry. Representative dot plots (top) and corresponding statistics (bottom) are presented. The number of samples evaluated for each group (median, IQR): donors: 17, 14-19.25; sarcoidosis: 30. (C), Ki-67 expression was evaluated in all viable PBMC, in CD4+ and CD8+ T cells, and in CD4+FOXP3+ Tregs by flow cytometry. Representative dot plots (top) and corresponding statistics (bottom) are presented. The number of samples: donors: 8, 6.5-8, sarcoidosis: 30. Additional flow cytometry data are shown in Supplementary Figures S2B-E. Blue dots represent donors, red squares illustrate data for treatment-naïve sarcoidosis patients, and black squares illustrate sarcoidosis patients receiving treatment. (A, B) - unpaired T test; (C) - Mann-Whitney test. Graphs show p values for all sarcoidosis samples. Corresponding results for the analysis of treatment-naïve subset versus donors: (A) p = 0.006 for IL-18, p = 0.001 for sCD25, p = 0.001 for CXCL10 and p= 0.0299 for TNFR II, unpaired T test. (B) p <0.0001 for CD4, p = 0.144 (not significant) for CD8, p = 0.009 for FOXP3+ in PBMC and p = 0.033 for FOXP3+ in CD4, unpaired T test. (C) p = 0.007 for Ki-67+ in PBMC, p <0.0001 for Ki-67+ in CD4+, p = 0.008 for Ki-67+ in CD8+ and p <0.0001 for Ki-67+ in Treg, Mann-Whitney test.

