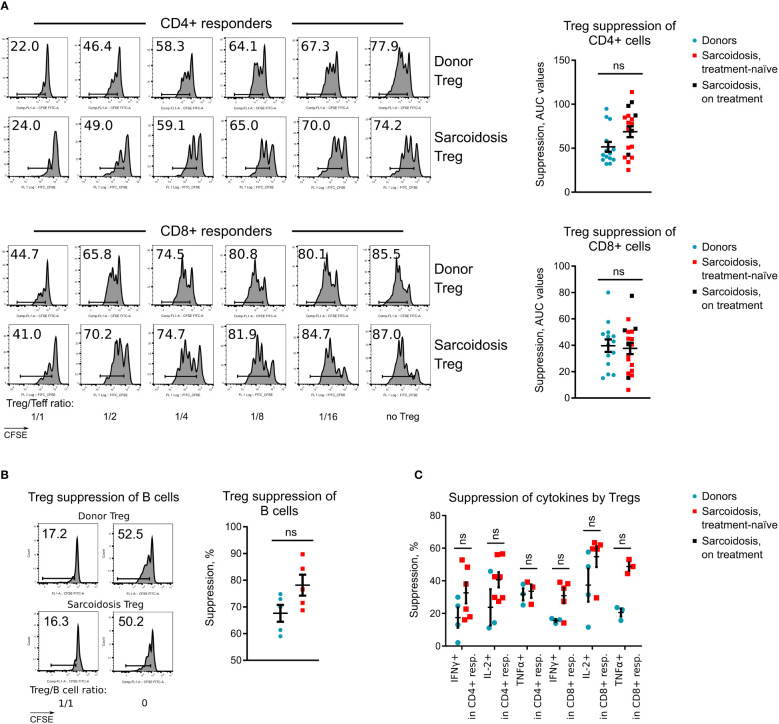
Figure 2.
Treg suppressive function in sarcoidosis, (A), Treg suppressive function was evaluated in 14 healthy donors and 20 sarcoidosis patients. Representative CFSE plots for CD4+ and CD8+ T cell responders (left) and statistics of Treg function adjusted for FOXP3+ Treg purity after isolation (right) are shown. Additional data for Treg suppressive function are presented at Supplementary Figures S2F, G. (B), Capability of Tregs to suppress CD4+ T-helper dependent divisions of healthy donor B cells was evaluated in 5 healthy donors and 5 sarcoidosis patients. CFSE plots for CD19+ B cell divisions (left) and statistics (right) of Treg function are shown. (C), Capability of Tregs to suppress cytokine productions by healthy donor CD4+ and CD8+ T cells, stimulated overnight with CD3-microbeads and stimulated the following day with phorbol myristate acetate + ionomycin is shown. The number of samples evaluated for each group (median, IQR): donors 3, 3-4, sarcoidosis 5, 3-6.25. Blue dots represent donors, red squares illustrate data for treatment-naïve sarcoidosis patients, and black squares illustrate sarcoidosis patients receiving treatment. (A, B) - Mann-Whitney test; (C) - multiple T-tests with Holm-Sidak correction. ns, non-significant. In A, graphs show p values for all sarcoidosis samples. Corresponding results for the analysis of treatment-naïve subset: p = 0.071 (not significant) for CD4+ responders and p = 0.955 (not significant) for CD8+ responders, Mann-Whitney test.

