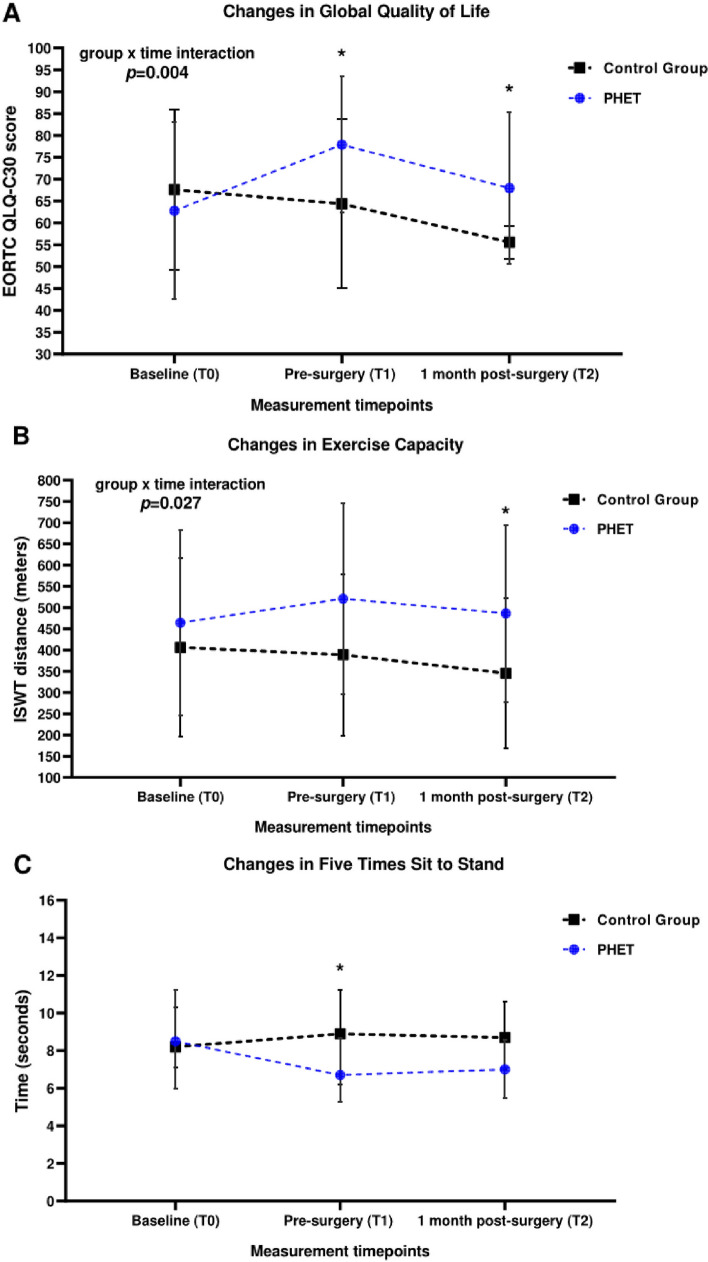
Fig. 3.
A Changes in Global Quality of Life scale across the study period. Data are expressed as means ± standard deviations. *Significant difference (p < 0.05) between groups (independent-sample t test). B Changes in exercise capacity across the study period. Data are expressed as means ± standard deviations. *Significant difference (p = 0.019) between groups (independent-sample t test. C Changes in five-times sit-to-stand across the study period. Data are expressed as median (interquartile range). *Significant difference (p = 0.041) between groups (Mann-Whitney U test). EORTC QLQ-C30, European Organization for the Research and Treatment of Cancer Quality of Life Questionnaire

