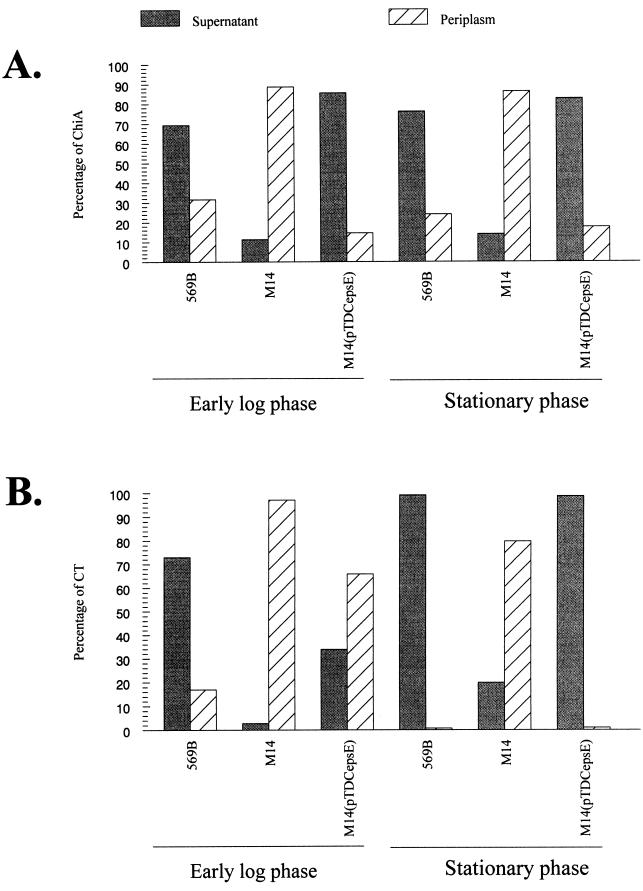
FIG. 7.
Localization of ChiA and CT in wild-type and mutant V. cholerae. Percentage values represent the relative amounts of ChiA and CT in the respective samples. (A) Total immunoreactive ChiA in culture supernatants and periplasmic extracts. Semiquantitative data were obtained from densitometric analysis of the immunoblots in Fig. 6. (B) Total CT in the culture supernatants and periplasmic extracts used for the immunoblot shown in Fig. 6. CT in the samples was measured by GM1 ELISA (4, 11).

