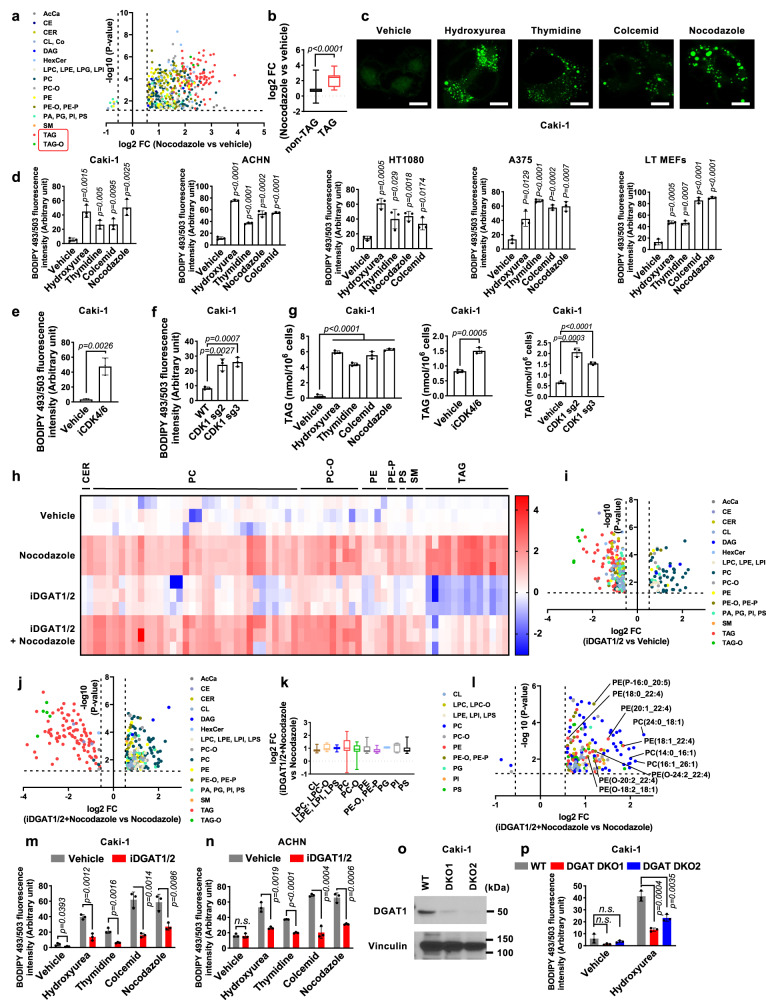
Fig. 2. Cell cycle arrest induces lipid droplet accumulation.
a Volcano plot displays log2 fold-change (FC) in lipid species abundance, comparing nocodazole-treated to vehicle-treated Caki-1 cells (n = 510, P < 0.05, FC > 1.5). AcCa, acyl carnitine; CE, cholesterol ester; CER, ceramide; CL, cardiolipin; Co, coenzyme; DAG, diacylglyceride; HexCer, hexosyl ceramides; LPC, lysophosphatidylcholine; LPE, lysophosphatidylethanolamine; LPG, lysophosphatidylglycerol; LPI, lysophosphatidylinositol; PC, phosphatidylcholine; PC-O, ether-linked phosphatidylcholine; PE, phosphatidylethanolamine; PE-O/PE-P, ether-linked phosphatidylethanolamine; PA, phosphatidic acid; PG, phosphatidylglycerol; PI, phosphatidylinositol; PS, phosphatidylserine; SM, sphingomyelin; TAG, triacylglyceride; TAG-O, ether-linked triacylglyceride. b Boxplots displaying log2 FC in non-TAG (n = 413) and TAG (n = 97) lipid species abundance between nocodazole-treated and vehicle-treated Caki-1 cells, with medians and whiskers indicating min-max values. BODIPY 493/503 staining in Caki-1 cells after 48 h of cell cycle inhibitor treatment. scale bar, 20 μm (c), and quantifications in the indicated cell lines (d). BODIPY 493/503 staining in Caki-1 cells treated with iCDK4/6 for 48 h (e), or WT and sgCDK1 cells (f). g Triglyceride concentrations in Caki-1 cells. h Heat map of the significantly changed lipids (unpaired, two-tailed t-test; FDR-corrected P < 0.05, fold change > 1.5 in vehicle- versus nocodazole-treated Caki-1 cells). Rows represent samples, columns represent normalized intensities, color-coded from red (high intensity) to blue (low intensity). Volcano plots for iDGAT1/2-treated versus vehicle-treated (i, n = 276) and iDGAT1/2 and nocodazole-treated versus nocodazole-treated (j, n = 302) Caki-1 cells. Log2 FC in phospholipid abundance comparing iDGAT and nocodazole-treated to nocodazole-treated Caki-1 cells, depicted with boxplots (k) and volcano plots (l). n = 192. LPC-O, ether-linked lysophosphatidylcholine; LPS, lysophosphatidylserine. BODIPY 493/503 staining in Caki-1 (m) and ACHN (n) cells. o Immunoblot of DGAT1 in Caki-1 cells. p BODIPY 493/503 staining in WT, DGAT DKO1, and DKO2 Caki-1 cells with or without exposure to hydroxyurea (0.3 mM) for 48 h. Mean ( ± SD) values are shown. n = 3. n indicates independent repeats, except a, b, i, j, k, and l. unpaired, two-tailed t-test. n.s. not significant. Source data are provided as a Source Data file.

