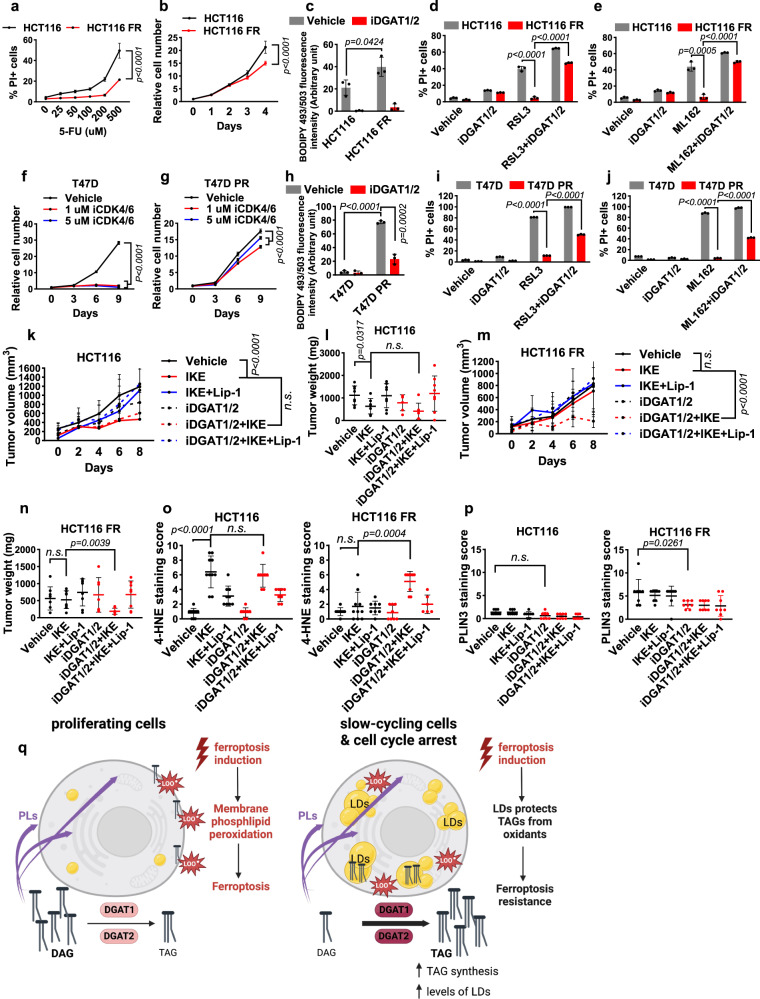
Fig. 4. Treatment of slow-cycling therapy-resistant cells.
a PI-positive populations of parental HCT116 and HCT116 FR cells treated with 5-FU for 24 h. b HCT116 and HCT116 FR cell growth over 5 days. c The relative intensities of BODIPY 493/503 staining in HCT116 and HCT116 FR cells treated with iDGAT1/2 for 48 h. The populations of PI-positive cells treated with 10 μM RSL3 and iDGAT1/2 (d) or 10 μM ML162 and iDGAT1/2 (e) for 24 h. The relative numbers of parental T47D (f) and T47D PR (g) cells measured every 3 days. Cells were cultured with or without iCDK4/6. h The relative intensities of BODIPY 493/503 staining in T47D and T47D PR cells treated with iDGAT1/2 for 48 h. The populations of PI-positive cells treated with 100 nM RSL3 and iDGAT1/2 for 24 h (i) or 200 nM ML162 and iDGAT1/2 for 18 h (j). Volumes (k) and weights (l) of HCT116 xenograft tumors in the indicated treatment groups. n = 8 for vehicle, IKE+Lip-1, iDGAT1/2 + IKE+Lip-1; n = 7 for IKE, iDGAT1/2 + IKE; n = 6 for iDGAT. Volumes (m) and weights (n) of HCT116 FR xenograft tumors in the indicated treatments groups, n = 8, except for iDGAT (n = 7). Immunochemical scoring of 4-HNE (o) and PLIN3 (p) staining in tumor sections. n = 8 in HCT116, except for vehicle, IKE (n = 10) and IKE+Lip-1 (n = 9). n = 8 in HCT116 FR, except for IKE (n = 10), iDGAT+IKE (n = 9) and iDGAT+IKE+Lip-1 (n = 6) were used for 4-HNE and n = 8 was used for PLIN3 staining. q Working model. See the Discussion for a detailed description. PLs, phospholipids; LOO•, peroxy radical; LD, lipid droplet. Figure 4q is created using BioRender. Mean (±SD) values are shown. n = 3. n indicates independent repeats (a–j), P values were calculated using two-way ANOVA (a, b, f, g, k, and m) or an unpaired, two-tailed t-test. n.s. not significant. Source data are provided as a Source Data file.

