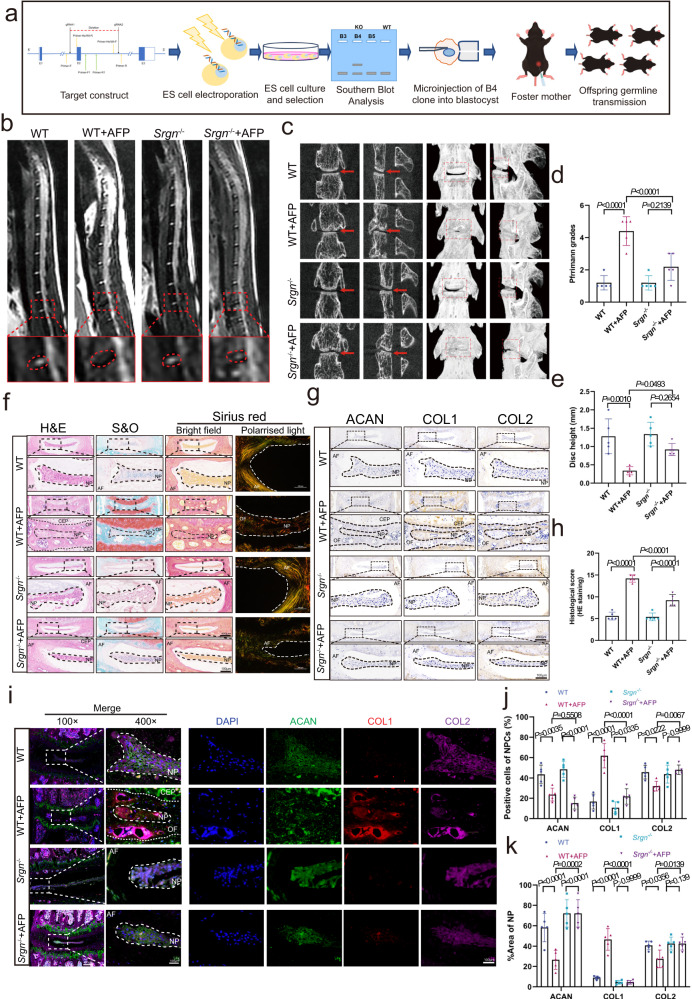
Fig. 3. Inhibition of SRGN alleviates the progression of IVDD.
a Flow diagram for establishing Srgn−/− mice. b, d MRI images and Pfirrmann grade analysis of Srgn−/− mice and IVDD models at 8 weeks after operation. c, e Micro-CT images and disc height analysis of Srgn−/− mice and IVDD models 8 weeks after operation. f, h H&E staining, Safranin-O staining, and bright field Sirius red staining with polarized light images of IVD tissue from Srgn−/− mice and IVDD models 8 weeks after operation (original magnification ×100, ×400, scale bar = 400 µm, 100 µm). g, j IHC staining for COL1, COL2, and ACAN in WT, Srgn−/−, WT plus AF, and Srgn−/− plus AF mice 8 weeks after operation (original magnification ×100, ×400, scale bar = 400 µm, 100 µm). i, k IF staining of COL1 (red), COL2 (purple), and ACAN (green) in WT plus AF and Srgn−/− plus AF mice 8 weeks after operation (original magnification ×100, ×400, scale bar = 400 µm, 100 µm). CTR control group, AFP annulus fibrosus puncture group, AF annulus fibrosus, CEP cartilaginous end plate, NP nucleus pulposus. n = 5 each group. Data are represented as mean ± standard deviation. P values were determined by one-way ANOVA with post hoc Bonferroni correction or Kruskal-Wallis H test with a Dunn’s correction as appropriate. Source data are provided as a Source Data file.

