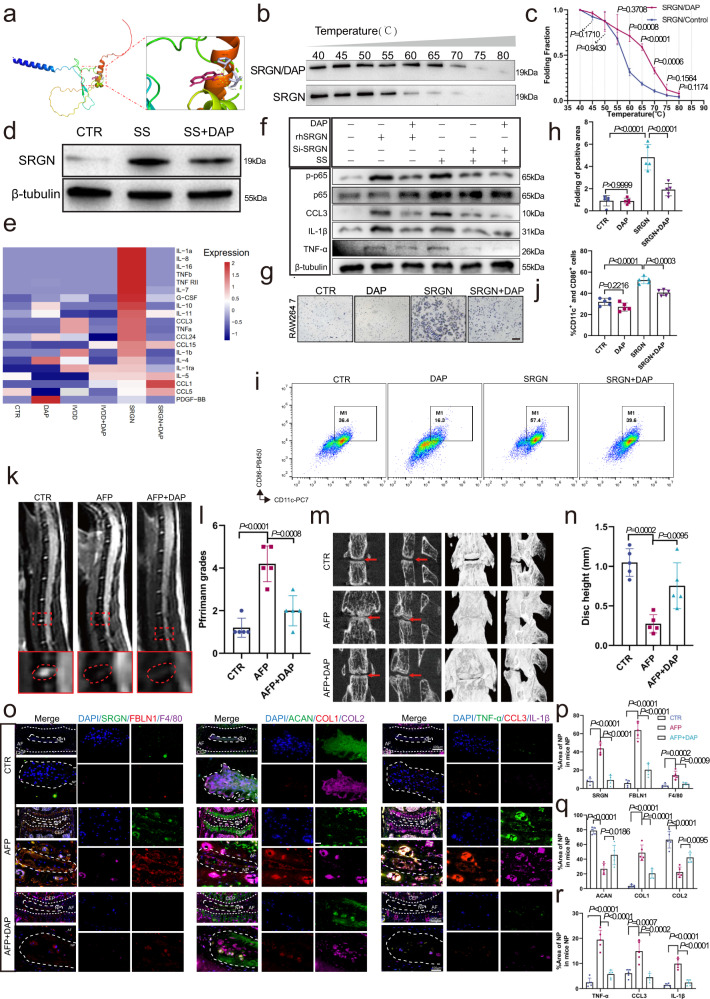
Fig. 7. DAP attenuates the IVD local inflammatory response to alleviate IVDD.
a Ligand interaction diagram of the top-scoring molecular docking complexes of the DAP and SRGN proteins (RMSD = 0.406; estimated free energy of binding = −15.313 kJ/mol). b CETSA of DAP and protein. c Principal criteria for evaluating the significance of protein stabilization in the melt curve. d Western blotting analysis of SRGN expression in the starvation-induced IVDD group and the DAP treatment group. e Heatmap of significant inflammatory cytokines based on cytokine array results of NPCs with different treatments. f Western blotting analysis of p-P65, CCL3, IL-1β, and TNF-α expression with different treatments. g, h Migration of RAW264.7 macrophages after si-SRGN or si-P65 treatment (original magnification ×100, scale bar = 200 µm). i, j Flow cytometry of CD11c+ and CD86 + RAW264.7 cells treated with SRGN and DAP. k, l MRI images and Pfirrmann grade analysis of control, AF, and AF plus DAP mice 8 weeks after operation. m, n Micro-CT images and disc height analysis of control, AF, and AF plus DAP mice 8 weeks after operation. o–r IF staining of COL1A1, COL2A1, ACAN, IL-1β, TNF-α, CCL3, and F4/80 in AF and AF plus DAP mice 8 weeks after operation (original magnification ×100, ×400, scale bar = 400 µm, 100 µm). CTR control group, SS serum starvation; n = 3 each group in (b–d) and (f), n = 5 each group in (g–r). Data are represented as the mean ± standard deviation. p values were determined by one-way ANOVA with a post hoc Bonferroni correction. Source data are provided as a Source Data file.

