Figure 2.
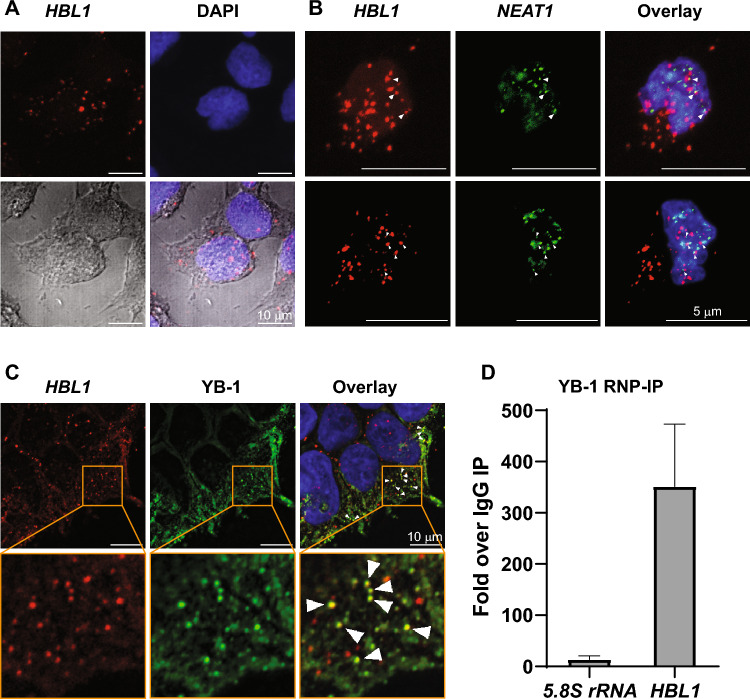
Subcellular localization of HBL1. (A) Human induced pluripotent stem cells were subjected to RNA FISH to detect HBL1 lncRNA (shown in red). Nuclei were stained with DAPI (blue). Cells were visualized with transmitted light to appreciate the nuclear and cytoplasmic localization of HBL1. Scale bar = 10 µm. (B) On day 5 of differentiation toward cardiomyocytes, cells were subjected to double RNA FISH with probes targeting HBL1 and NEAT-1 lncRNAs. HBL1 is shown in red, NEAT-1 is shown in green, and DAPI-stained nuclei are shown in blue. Adjacent localization is shown by white triangles. Scale bar = 5 µm. (C) Human induced pluripotent stem cells were subjected to HBL1 and YB-1 immuno-RNA FISH. HBL1 is shown in red, YB-1 is shown in green, and DAPI-stained nuclei are shown in blue. Colocalization is shown by white triangles. Scale bar = 10 µm. (D) HiPSCs were collected and subjected to RNP-IP protocol using a Magna RIP® RNA-Binding Protein Immunoprecipitation Kit according to the manufacturer’s instructions. A nonspecific IgG control was included in the experiment. Data are shown as the mean ± standard deviation (n = 3). P-values relative to IgG IP are: 0.1181 for 5.8S rRNA and 0.0553 for HBL1, Student’s t-test, two-tailed, paired.

