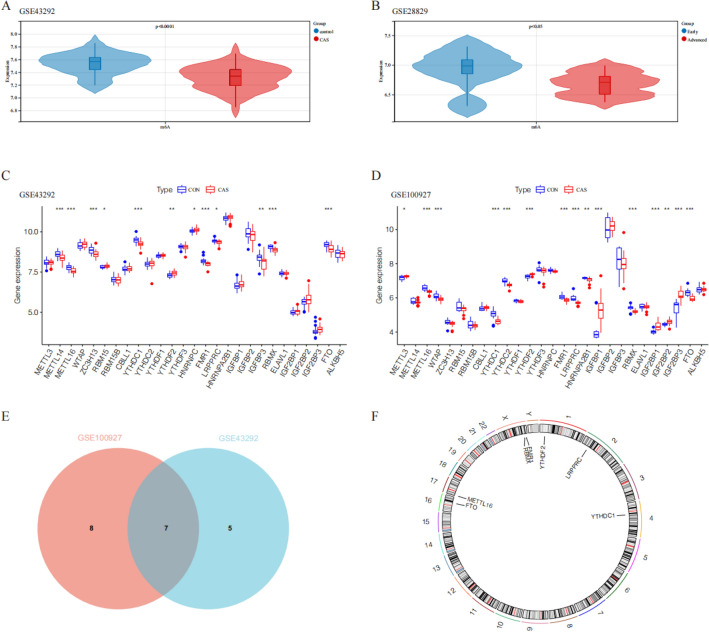
Figure 1.
The expression and distribution of m6A regulatory factors in CAS. Box plots depicting the expression of 27 m6A regulatory factors in normal and CAS groups (A) early-stage CAS and late-stage CAS groups (B). Box plots illustrating the expression of 27 m6A regulatory factors in the GSE43292 and GSE100927 datasets (C, D). (E) Box plots illustrating the expression of 27 m6A regulatory factors in the GSE43292 and GSE100927 datasets. (F) Location of variations in m6A regulatory factors on 22 chromosomes. *P < 0.05; **P < 0.01; ***P < 0.001.

