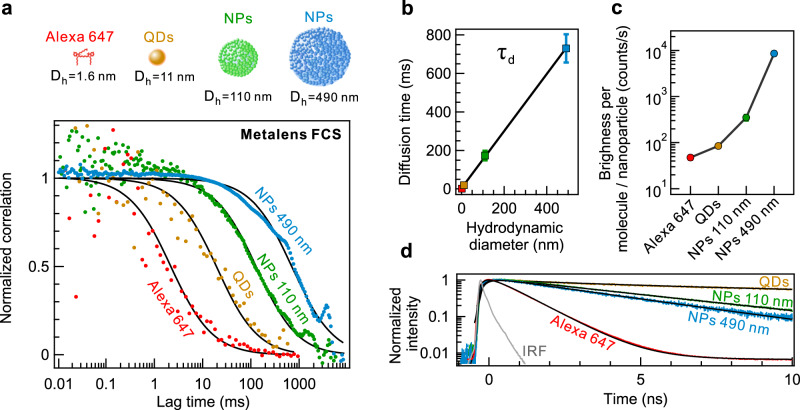
Fig. 6. Single nanoparticle detection and size identification.
a Normalized FCS correlation functions of Alexa 647, quantum dots (QDs), plastic nanoparticles (NPs) covered with organic dyes. Corresponding hydrodynamic diameters (Dh) are depicted in top panel. Hydrodynamic diameter data of Alexa 647 is adopted from ref. 69., that of QDs from ref. 70, those of NPs from supplier test report. Alexa 647 molecules were excited at 1 mW laser power, whereas QDs and NPs are excited at 100 μW. b Retrieved diffusion time (τd) of emitters as a function of their Dh. Black line corresponds to linear fit following Stokes–Einstein diffusion law. c Brightness values of single Alexa 647 molecules and nanoparticles (CRM) retrieved from FCS correlation function analysis. Error bars denote standard deviation of FCS experiment. d Fluorescence decays of analyzed emitters. Black lines correspond to fluorescence decay fits. Owing to long lifetime of QDs, repetition rate of laser pulse emission is set to 5 MHz.

