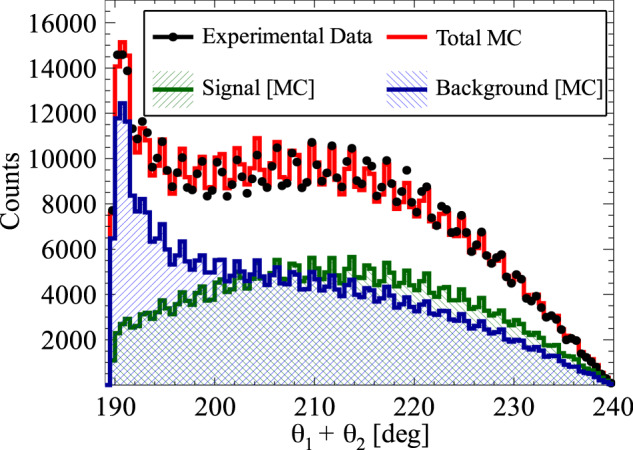
Fig. 5. Distribution of the sum of the two smallest relative azimuthal angles (θi and θj) between the registered annihilation photons (projection on the horizontal axis of experimental data from Fig. 2a and simulation of background and signal events (Fig. 8b, c, respectively).

Experimental data points are marked with black circles, while histograms represent the results of reconstructed Monte Carlo simulations for signal (green), background (blue), and combined signal and background simulated distributions (red). The experimental histogram contains all the events after the analysis. Visible multiple maxima and minima are due to distances between scintillating strips (Fig. 1b). The main maximum at 190° is in fact a remaining tail of background component of the p-Ps → 2γ process where θi + θj = 180° and one of the photons undergoes a single scattering.
