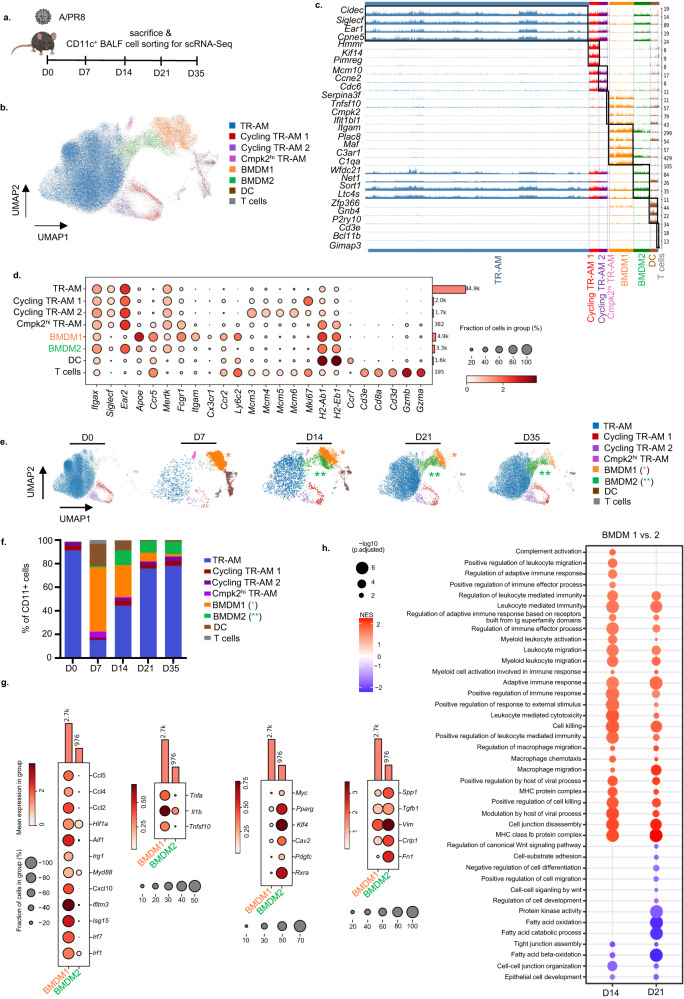
Fig. 1. scRNA-seq analyses reveal two distinct alveolar BMDM clusters with defined kinetics of appearance over the course of IAV infection.
a Schematic representation of the infection model and sample collection in uninfected mice (D0) and at the indicated time points p.i. The figure was created with BioRender. b Uniform manifold approximation and projection (UMAP) map displaying CD11c+ alveolar cell clusters (pooled data from all time points), integrated and embedded using the Harmony algorithm. Colors represent different cell populations after Leiden clustering in 1.4 resolution (58,998 individual cells with signals from 32,286 genes; average number per time point from n = 3–5 mice). c Track plot showing unbiased analysis of the top three to five expressed genes in each particular cluster; pooled data from all time points. d Dot plot representing signature markers for each cell cluster. The size of the dots encodes the percentage of cells within a cluster expressing a particular marker. Color of the dots represents the average expression level throughout all cells within a cluster. e UMAP depiction of alveolar CD11c+ cell clusters at the respective time points p.i. f Stacked bar chart showing the percentage of CD11c+ cells during the infection course. g Dot plots displaying expression of selected phenotype markers in BMDM1 and BMDM2 populations. Genes shown in the plot were selected among the significantly higher expressed genes (p < 0.05), The Wilcoxon rank sum test was employed as the statistical method. The size of the dots encodes the percentage of cells within a cluster expressing a particular marker. Color of the dots represents the average expression level throughout all cells within a cluster. h Gene ontology (GO)-based GSEA showing normalized enrichment scores (NES) for expression differences of genes comparing BMDM1 compared to BMDM2 on D14 and 21 p.i. An array of statistical tests provided by the fgsea package was employed. Data in (b)–(h) refer to the experiment depicted in (a). Tissue-resident alveolar macrophages (TR-AM), bone marrow-derived macrophages (BMDM), dendritic cell (DC), T lymphocyte (T).

